Yield Curve Tells Investors When To Expect A Recession

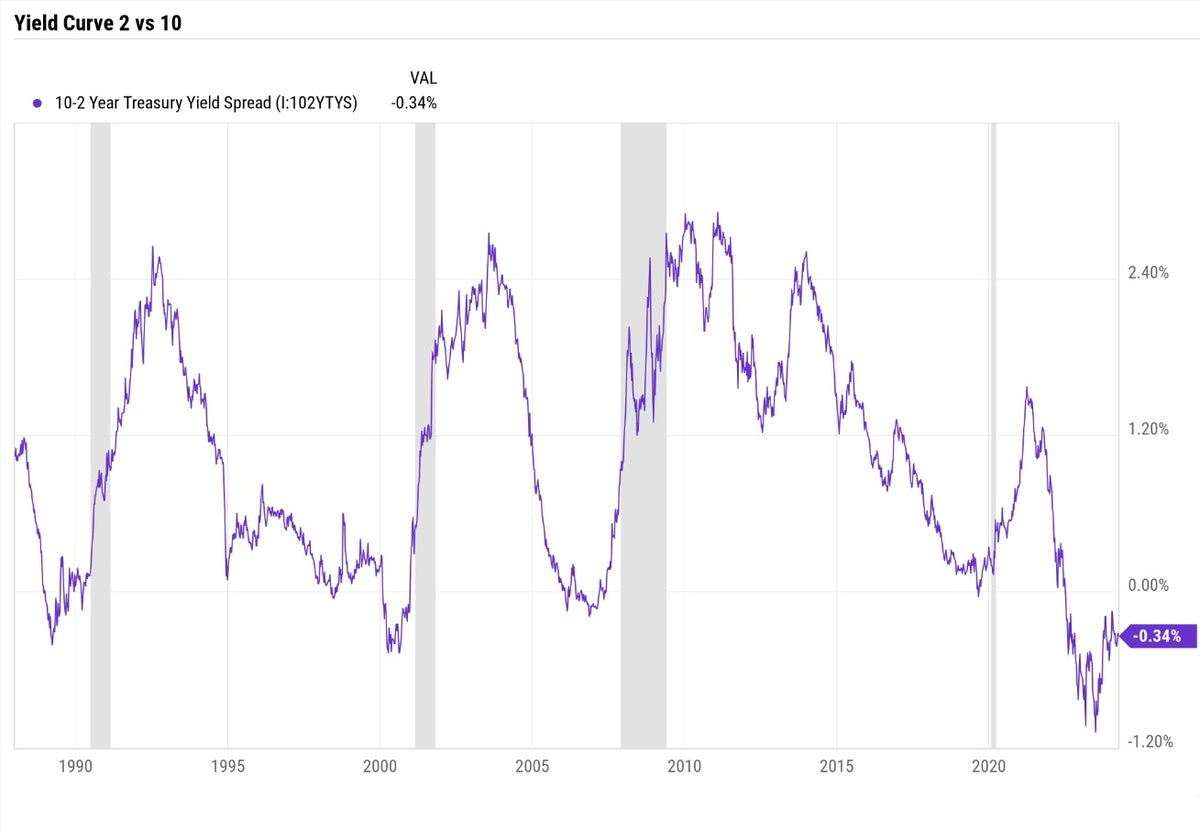
An inverted yield curve is when the 2 year yield goes above the 10 year yield. The yield curve has been inverted since July 2022. Most investors freaked out when the yield curve inverted, but if you look at the data, it is when the yield curve un-inverts that recessions hit.
Looking at the chart above clearly shows this. Going back to recessions since 1990, this has been the case. In the chart above, the gray areas are recessions. Notice how the yield curve is inverted prior to every recession but the recession does not hit until the yield curve un-inverts.
This distinction is insanely important as it tells investors why we have not seen a recession yet. If history repeats, investors should be on high alert for a recession as soon as the 10 year yield goes back above the 2 year yield (un-inverts).