Updated: Apr 22, 2024 | Published: Apr 13, 2024
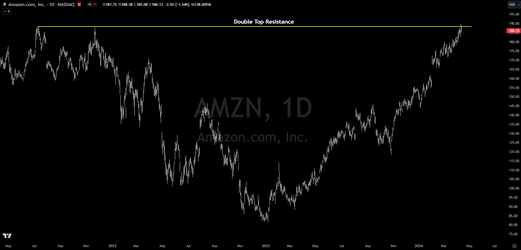
Amazon.com Slams Into Double Top Resistance
Amazon.com (AMZN) hit double top resistance this past Thursday, only to be slammed back down on Friday's stock market decline. On Thursday, it briefly made a new all-time high.
Alphabet (... [Read More]