Pro Charts: Stocks & ETFs
Dollar Breakout: Here Is Technical Chart Resistance
Updated: Apr 22, 2024 | Published: Apr 13, 2024

By Verified Investing
The U.S. Dollar broke out two weeks ago. This told investors of the coming fear that caused the sell off in the stock market. Remember, the Dollar is a safe haven asset to the whole world. Therefore, a break out on the US Dollar is very telling.
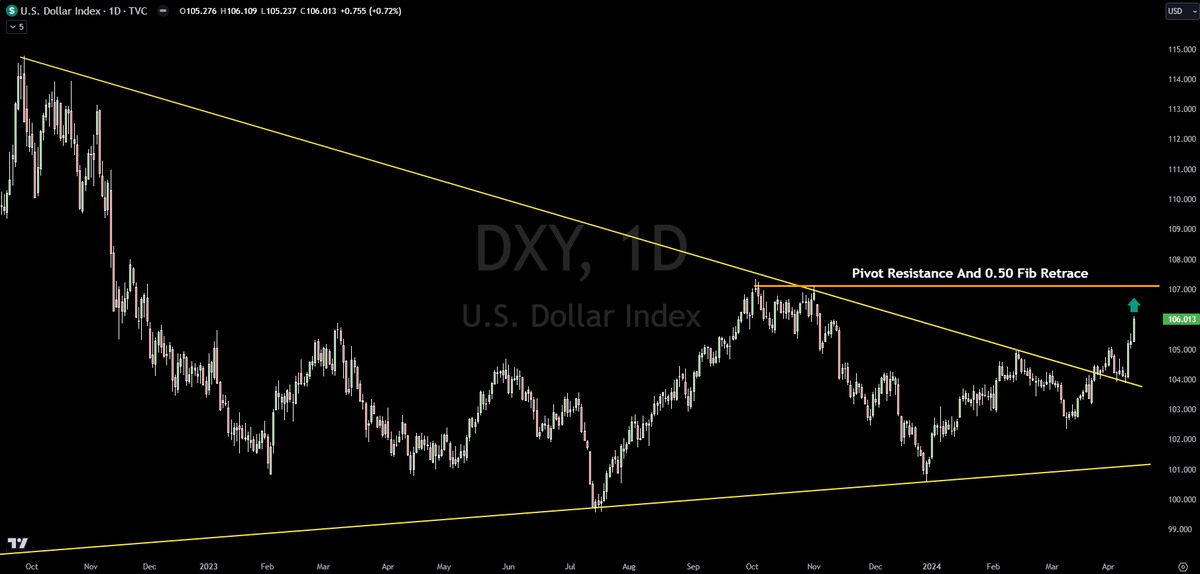
The surge in the U.S. Dollar this week is nearing resistance. The technical level to watch is $107.15 on the DXY. This is the pivot high from October 2023 and also a .50 Fibonacci retrace September 2022 highs (highest Dollar in 20+ years).
This raises the probability that if this level is hit, the U.S. Dollar will pull back.