NASDAQ 100 Repeating 2021 Top Chart Pattern

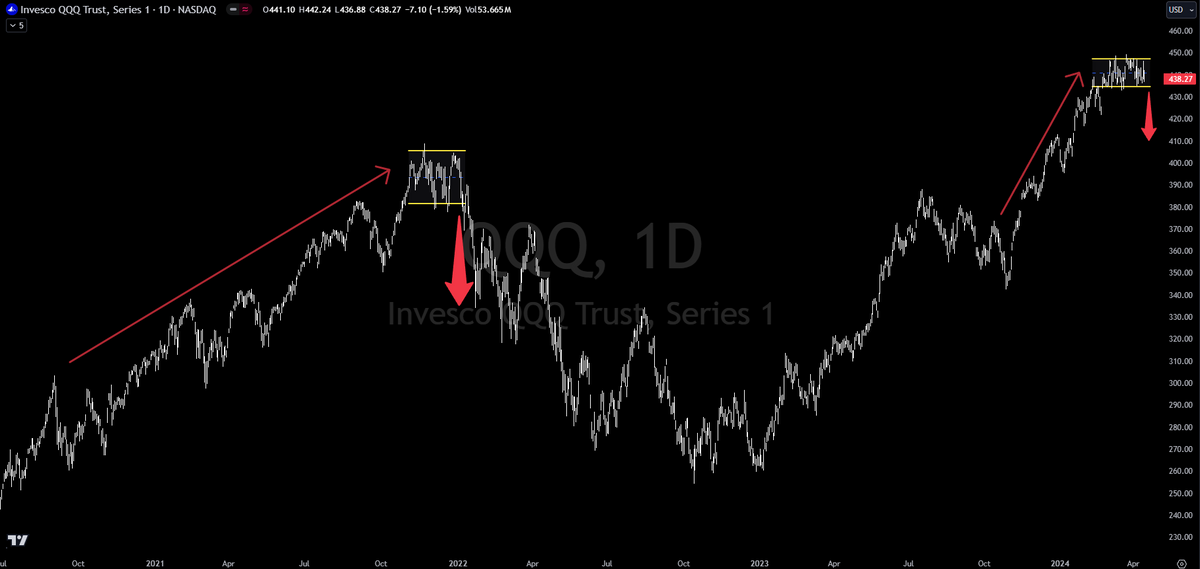
The NASDAQ 100 may be replicating the chart pattern that topped the markets in 2021. In 2021, after a long sustained uptrend, the NASDAQ 100 chopped sideways for a month. This is known as distribution. Distribution is where retail investors are buying (FOMO-ing in) while institutions are unloading.
It has been discussed here many times in the last month about the massive insider selling going on and how that happened in 2021, just before the top was put in.
In 2021, after that sideways chop, the NASDAQ 100 declined 37%.
Investors are now witnessing the same pattern formation in 2024. After a long, sustained uptrend, price has chopped sideways for about a month. Is the NASDAQ 100 about to break lower? If it does, will it be a 30-40% decline?
Probabilities tell investors to be cautious.