My Trading Game Plan Revealed - 11/19/2026: Anthropic IPO Liquidity Shock Sparks Tech Bounce and Sector Rotation

Anthropic IPO Tests Market Liquidity as Gareth Soloway Spots a Nasdaq Bullish Signal
The Anthropic IPO is arriving at a critical moment for the stock market. Technology stocks are rebounding after several sessions of weakness, but the S&P 500 and Nasdaq are showing different technical structures. For Gareth Soloway, Chief Market Strategist at Verified Investing, that divergence is central to understanding whether the current bounce has room to continue.
During the November 19 edition of My Trading Game Plan, Gareth examined how the massive Anthropic offering may have affected liquidity across the market, why the Nasdaq's recent price action suggests buyers are defending an important technical level, and where traders should look for confirmation. He also connected the movement in Nvidia, Walmart, Bitcoin, and precious metals to the broader shift in risk appetite.
Anthropic IPO: How an $81 Billion Offering Could Affect Stock Market Liquidity
Anthropic is scheduled to begin trading on the Nasdaq today under the ticker ANT after pricing its initial public offering at $83 per share. The public offering totals approximately $81.34 billion, making it an unusually large capital-raising event and a significant test of investor appetite for artificial intelligence stocks.
Gareth's interpretation centers on the potential liquidity impact. When institutions participate in an offering of this size, some may sell existing positions to raise capital. That process can create temporary pressure elsewhere in the market, particularly among liquid technology holdings that have delivered substantial gains. It offers one possible explanation for the recent weakness in established AI-related stocks.
The timing is important. Technology shares have struggled even as some companies delivered strong earnings and guidance. Gareth believes capital being redirected toward Anthropic may have contributed to that selling. The relationship is difficult to prove from price action alone, but it provides a framework for understanding why individual company fundamentals and short-term stock performance have moved in different directions.
The next signal comes from Anthropic's trading debut. Gareth outlined two potential scenarios: a strong opening followed by sustained buying could improve sentiment across technology stocks, while an early surge that quickly reverses would raise questions about demand. With Nasdaq futures rising roughly 2% before the opening bell, traders will be looking for evidence that the broader technology rebound can hold once regular trading begins.
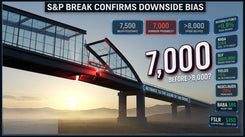
S&P 500 Technical Analysis: Broken Trend Line Puts 7,000 in Focus
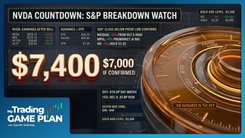
Despite the strength in premarket futures, Gareth remains attentive to the technical damage in the S&P 500. The index recently broke below a longer-term ascending trend line, changing the chart's near-term structure. A rebound toward that broken support creates an important test because the same line can become resistance.
Gareth is watching how price behaves as it approaches that area. A rally that stalls beneath the former support line would leave the breakdown intact and keep downside risk elevated. Reclaiming the line and holding above it would weaken the bearish interpretation and suggest buyers are regaining control.
His larger downside reference is the 7,000 area, which he associates with previous market turning points and support. A move toward that level could create a more attractive opportunity for longer-term buyers, depending on the price action and broader market conditions when it arrives.
That leaves the S&P 500 in a position where a strong bounce can coexist with a damaged chart. The key is whether the recovery changes the underlying structure or simply tests resistance following the breakdown.
Nasdaq and QQQ: Two Daily Closes Signal Buyers Defending Support
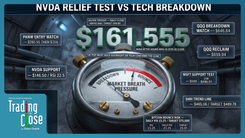
The Nasdaq presents a more constructive technical picture. Gareth highlighted a major ascending trend line connecting the April 2025 tariff-related selloff low with the March 2026 low during the oil-price shock. That line has become an important reference for assessing the durability of the technology sector's longer-term uptrend.
During the latest decline, price briefly moved beneath the trend line. However, the market recovered before the close on both November 17 and November 18, leaving two consecutive daily candles above support. Gareth views those recoveries as a sign that buyers are willing to defend the area.
That behavior is consistent with a potential bear trap. Sellers push price below a widely watched technical level, but the breakdown fails to hold. When the market closes back above support, traders who entered bearish positions may find themselves on the wrong side of the move.
Gareth interprets the repeated recoveries as possible evidence of institutional accumulation, particularly against a backdrop of fearful investor sentiment. The chart alone cannot identify who is buying, but the ability to reclaim support on successive sessions gives the bullish case more weight.
For QQQ, the next test is whether buyers can build on those recoveries. Continued daily closes above the ascending trend line would support Gareth's constructive interpretation. A sustained break beneath it would remove an important part of that argument and increase the risk of another leg lower.
Nvidia Stock Outlook: A Potential Bounce With $141 Support Below
Nvidia remains one of the clearest gauges of technology-sector sentiment. The stock has pulled back sharply despite strong earnings-related developments, and Gareth believes the recent selling may partly reflect the broader movement of capital surrounding the Anthropic offering.
With Nvidia trading around $153 in the session discussed, Gareth identified $141 as a significant lower support area. That level becomes particularly relevant if the current recovery fails and sellers regain control. In the nearer term, he sees the possibility of a rebound toward $165 to $170 before the stock encounters another meaningful technical test.
The distinction between a tradable bounce and a sustained recovery is important here. Nvidia can rally substantially after a sharp decline without necessarily reversing the broader corrective pattern. Gareth's framework calls for watching how price behaves as it approaches resistance rather than assuming the first strong advance marks a lasting bottom.
He also emphasized the risk of taking aggressive short positions in a stock capable of moving sharply on earnings, corporate developments, or AI-related headlines. Even when the chart favors a correction, position sizing and exposure to overnight gaps remain important considerations.
Nvidia vs. Walmart: What Sector Rotation Reveals About Risk Appetite
Gareth also drew attention to an interesting relationship between Nvidia and Walmart. Nvidia's recent peak occurred around October 6, a period that also marked the beginning of a notable advance in Walmart shares. The opposing moves suggest investors may have been reducing exposure to higher-growth technology stocks while favoring businesses perceived as more defensive.
This type of rotation can offer useful information about market sentiment. When investors become less comfortable with risk, they may move capital toward companies with more stable demand and earnings characteristics. Walmart can attract that interest because of its consumer staples exposure, although it remains sensitive to consumer spending and its own earnings outlook.
The relationship is worth watching as technology stocks attempt to recover. If Nvidia and other major AI names regain momentum while Walmart weakens, that would be consistent with improving risk appetite and a potential reversal of the earlier rotation.
Gareth's observation does not establish that the same institutions are selling one stock to buy the other. It does, however, highlight a useful way to compare leadership across sectors. Sustained strength in technology alongside weakness in defensive names would offer additional context for the Nasdaq's attempt to hold support.
Gold and Silver Technical Analysis: Support Levels and Position Sizing
Precious metals are another area where Gareth sees potentially important technical opportunities following recent selling. Gold has reached a descending trend line that he considers meaningful support, creating the possibility of a relief rally. However, his broader downside scenario still includes the $3,500 area if the current support structure eventually fails.
Silver has also tested a major support zone near $45 before attempting to recover. Gareth discussed his own exposure through the iShares Silver Trust (SLV), using the position to illustrate how he approaches larger investments near technical levels.
The central lesson is position sizing. Gareth described keeping the allocation within a defined portion of his investing capital rather than committing an excessive amount to a single idea. That discipline allows a trader to maintain exposure to a potential recovery while accounting for the possibility that the support level fails.
A technically attractive setup can still produce a loss. Support levels are areas where buyers may respond, not guarantees that price will reverse. For traders considering precious metals after a sharp decline, the relevant questions are where the setup becomes invalid, how much capital is exposed, and whether the potential reward justifies the risk.
Bitcoin and Nvidia: A Correlation Worth Watching
Bitcoin's recent performance provides another perspective on risk appetite. Gareth noted that Bitcoin reached a significant high around October 5, just before Nvidia's peak around October 6. Both assets subsequently weakened, creating a notable similarity in their recent price structures.
The timing supports Gareth's observation that Bitcoin and high-growth technology stocks can respond to some of the same changes in investor sentiment. When market participants become more willing to take risk, capital may flow toward both. During periods of tightening liquidity or declining confidence, both can come under pressure.
That relationship is useful as a secondary confirmation tool. If technology stocks extend their recovery and Bitcoin begins to strengthen alongside them, it could reinforce the argument that broader risk appetite is improving.
The correlation is not constant, and Bitcoin has its own market-specific catalysts. Gareth's comparison is best understood as another signal within the broader market framework rather than a dependable one-for-one relationship.
Federal Reserve Outlook: December Rate Hike Expectations Add Another Risk
The macroeconomic backdrop remains important as traders evaluate the market's recovery. Initial jobless claims were reported at 203,000, while the Philadelphia Fed manufacturing report pointed to weaker activity. Together, the releases offer a mixed picture of an economy facing persistent inflation concerns alongside signs of softer growth.
The Federal Reserve's next policy decision adds another layer of uncertainty. Governor Christopher Waller has discussed the possibility of a 50-basis-point increase in December or a smaller move accompanied by clear communication about additional tightening. The size and timing of future increases remain dependent on incoming data and the broader committee's assessment.
For equities, the transmission mechanism runs through interest rates, financing conditions, and valuations. Higher expected rates can weigh particularly heavily on growth stocks whose valuations depend on future earnings. That makes Treasury yields and Fed communication important alongside the technical levels Gareth is tracking.
A sustained technology recovery would be more convincing if it develops without a renewed surge in yields. Conversely, a stronger-than-expected tightening outlook could challenge the rebound even if the current chart structure remains constructive.
Trading Risk Management: Why Gareth Scales Out of Winning Positions
One of Gareth's recurring lessons is that identifying a favorable setup is only part of successful trading. Managing the position after entry can be just as important, especially when markets are attempting to recover from a sharp decline.
A trader may correctly identify support and still have little certainty about the size of the resulting bounce. Price could rise a few percentage points, extend much further, or reverse before reaching the initial target. Gareth's approach emphasizes taking partial profits as a position moves favorably rather than requiring a perfect exit at the eventual high.
Scaling out reduces exposure while allowing a portion of the position to participate if the move continues. It also helps traders manage the psychological pressure that often accompanies volatile recoveries, when the temptation to hold for additional gains can interfere with a disciplined plan.
The appropriate amount to sell depends on the original setup, position size, and risk tolerance. The broader principle is to establish a process before emotions begin driving decisions. Traders who know where they intend to reduce exposure are better positioned to respond when price reaches those areas.
Gareth Soloway's Market Game Plan: What Traders Should Watch Next
The November 19 market setup comes down to several connected signals. Anthropic's trading debut will test demand for a major AI offering, while the Nasdaq's ability to defend its ascending trend line offers a potentially constructive technical signal. At the same time, the S&P 500 remains below a broken support line, leaving its recovery less convincing.
Gareth's framework calls for monitoring whether the technology bounce can hold, whether Nvidia can advance toward its next resistance area, and whether defensive stocks such as Walmart continue to lose relative strength. Bitcoin and precious metals provide additional context, while Treasury yields and Federal Reserve expectations remain potential sources of volatility.
Individual opportunities also remain on his radar, including a possible gap-fill setup in Palo Alto Networks near $94.50 and a rebound attempt in Alibaba. As with the broader indices, those ideas require confirmation from price action and disciplined risk management.
The most useful signal will come from what the market does after the initial excitement surrounding Anthropic's debut. If the Nasdaq maintains support and technology leadership strengthens, the recovery has a better technical foundation. If the bounce fades and key support levels give way, the risk of further downside increases.
For Gareth, the trading plan remains grounded in the charts: identify the important levels, wait for price to confirm the setup, and manage exposure before the market forces the decision.
This article summarizes market analysis and opinions discussed on My Trading Game Plan on November 19, 2026. It is provided for educational and informational purposes only and is not personalized financial advice. Trading and investing involve risk, including possible loss of principal.
Trading involves substantial risk. All content is for educational purposes only and should not be considered financial advice or recommendations to buy or sell any asset. Read full terms of service.