My Trading Game Plan Revealed - 03/23/2026: Oil Collapse, Bond Spike, S&P Bounce and Gold Turns Risk Asset

The financial markets are masterclasses in human psychology, geopolitical maneuvering, and technical precision. This morning's price action delivered a textbook example of all three colliding at once. As equity markets staged a massive bounce and oil prices collapsed dramatically, traders were reminded why relying on logic and charts consistently outperforms following hype and narratives.
In today’s My Trading Game Plan show, Gareth Soloway, Chief Market Strategist at VerifiedInvesting.com, broke down the exact technical setups and macro-level chess moves driving today's extreme volatility. From a perfectly executed short on oil to navigating the critical divergence in precious metals, today's analysis provides a masterclass in probability-based trading and timeframe management.
The Oil Collapse: When Technicals Meet Geopolitics
One of the most spectacular moves in recent market history unfolded early this morning as oil prices completely cratered. After creeping north of the $100 mark last night, oil experienced a straight-line drop from $101.5 down to below $85 a barrel. For traders who understand the confluence of chart patterns and political motivations, this collapse was not a surprise—it was a highly probable target.
"Any time you get something like that, you don't question it. You say thank you very much," Gareth noted, referencing the massive profits secured from shorting oil on Friday.
The setup for this trade was built on two distinct pillars: technical analysis and macroeconomic reality. On the daily chart, oil had formed a classic bearish inside bar pattern following a reversal candle featuring a prominent topping tail. A topping tail occurs when buyers push the price up intraday, only to be overwhelmed by sellers who drive the price back down to close near the lows. When followed by an inside bar—a period of consolidation entirely contained within the previous day's trading range—it frequently signals impending downward momentum.
But technicals don't exist in a vacuum. The macro catalyst was deeply tied to the current administration's political pressures. With midterms approaching, the administration faces a trifecta of problems: high oil prices fuel inflation, hurt the stock market, and financially benefit geopolitical adversaries like Iran.
"The president knows the midterms are coming up. You got to get oil down. You got to keep oil down," Gareth explained.
When a social media post surfaced at 7:00 AM mentioning "really good talks with Iran," the bottom fell out of the energy market. Even though Iranian officials later denied that any discussions took place, the market's reaction proved a vital point: the administration will utilize whatever rhetoric is necessary to suppress energy prices and support equities. Savvy traders were already positioned for this exact scenario. In fact, members of Verified Investing had picked up SCO (a 2X short oil ETF) at the $7.50 zone, securing rapid, substantial gains as the energy sector plummeted.
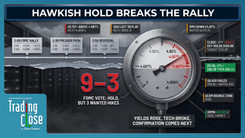
The 10-Year Yield: Approaching the Breaking Point
While oil stole the early morning headlines, the bond market quietly flashed a critical warning signal. The 10-year Treasury yield surged to 4.45% this morning before pulling back. To understand the gravity of this number, we have to look at the historical context of the U.S. debt burden and previous market cycles.
"We got as high as 4.45% and the president is trying to talk things back down, trying to help the market rally bring oil down, get yields to come back in. This is telling you something," Gareth pointed out.
During last year's Liberation Day tariff sell-off period, the stock market experienced severe downside pressure that only reversed when the 10-year yield hit the 4.5% threshold. Why is 4.5% the magic number? The United States carries an unprecedented debt load. When yields cross the 4.5% threshold, the cost of servicing that debt becomes suffocating. Furthermore, it aggressively tightens financial conditions, crushing the housing market, stalling corporate borrowing, and ultimately threatening to break the broader economy.
The dollar's chart is currently confirming this resistance zone. After breaking a massive support level, the U.S. dollar rallied back to test that exact line from underneath—a classic technical maneuver where prior support becomes new resistance. The rejection at this level aligns perfectly with the administration's urgent need to cap yields and support the stock market.
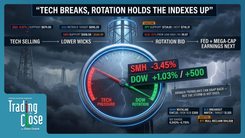
S&P 500 and NASDAQ: The Art of Timeframe Management
Equity markets, which had fallen as much as 7% off their all-time highs, staged a rip-roaring bounce this morning. The S&P 500 futures drove aggressively higher, bouncing perfectly off major technical support established by previous pivot lows. However, understanding this bounce requires a sophisticated grasp of timeframe management.
Many retail investors struggle with the concept of holding conflicting biases across different timeframes. Professional traders, however, thrive on it.
"While I expect bounces, I'm a swing trader. Remember that. So again, when things get oversold, I'm going to buy the market… Does it change the bigger macro that the US global economy is starting to crumble? No, it doesn't," Gareth emphasized.
This is the essence of elite trading. You can be a mid-term bear while operating as a short-term bull. The S&P 500's larger timeframe chart reveals a massive parallel trend channel dating back to 2021. The recent rejection at the upper boundary of this channel signals a broader macroeconomic rollover. Yet, markets never move in straight lines. When the index drops 7% into a major historical support zone, the high-probability play is to go long for the bounce, even if the ultimate destination months from now is significantly lower.
The NASDAQ exhibited a similar setup, attempting to break down on Friday amid weekend panic, only to find buyers stepping in to defend the technical line. By separating the macro economic outlook (recessionary pressures, weakening data) from the micro technical setup (oversold conditions at major support), traders can profit from 10% to 20% bounces in individual equities without abandoning their broader protective thesis.
Precious Metals: The Risk Asset Revelation
The precious metals sector provided one of the most crucial psychological and technical lessons of the morning. Gold experienced a sharp drop down to $4,100, while silver kissed the $60 to $61 level.
To put silver's move into perspective, the metal was trading at $120 earlier this year. When Gareth previously identified a bearish inside bar pattern on silver and projected a drop toward $50 or $60 an ounce, retail sentiment was overwhelmingly dismissive. Today, that target became a reality.
More importantly, the price action in gold is revealing a critical shift in market mechanics.
"Gold is behaving as a risk asset. It means the bottom is not in on gold yet," Gareth warned.
Historically, gold acts as a safe-haven asset, catching bids when equities sell off. However, during periods of intense market stress or liquidity crunches, gold often gets sold alongside equities as institutions are forced to raise cash to cover margin calls. Until gold decouples from the broader stock market and begins acting like a true safe haven again, the ultimate bottom is not in. The macro technical target for physical gold accumulation remains significantly lower, down in the $3,500 zone.
Despite this bearish macro view on the metals, the short-term oversold conditions provided immediate swing trading opportunities. Executing the "mid-term bear, short-term bull" strategy, Verified Investing members went long GDX and Newmont Mining in the pre-market, banking an impressive 8% gain on Newmont in just a few hours as the metals staged an intraday relief rally.
High-Probability Equity Setups: OKLO, Valero, and Sandisk
The morning's volatility created massive disparities in individual stocks, offering prime setups for traders willing to look past the panic.
OKLO: The Oversold Bounce
OKLO presents a fascinating case study in extreme valuation compression. Back in October of 2025, the stock was trading at a lofty $190 per share. Today, it is nearing the $50 mark, crashing directly into a beautifully established, multi-point trend line. While the stock may not see its all-time highs again anytime soon, the technical confluence at this $50 level makes it a prime candidate for a short-term swing trade bounce back toward the $60 to $65 range.
Valero: Shorting the Parabola
On the opposite end of the spectrum is Valero. While the broader market has been under pressure, Valero had been trading near all-time highs with a chart that had gone completely parabolic. Parabolic moves—where the angle of ascent becomes nearly vertical—are inherently unsustainable. When combined with the broader macroeconomic pressures on the energy sector and the administration's desperation to crush oil prices, shorting this parabolic extension offered a massive edge.
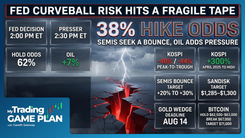
Sandisk and the Semiconductor Cycle
While the market bounced today, lifting names like Sandisk, a stark warning was issued regarding the fundamental reality of certain tech sectors.
"When they don't have proprietary stuff and memory chips are really not proprietary, in 6 to 12 months, most of these are probably down 50%," Gareth stated.
During tech manias, investors often treat all semiconductor and hardware companies equally. However, memory chips are largely commoditized. When the economic cycle turns and demand slows, companies without deep, proprietary moats suffer severe margin compression. Traders should use these market bounces not to fall in love with commoditized tech stocks, but to identify potential short entries for the next leg down.
The Ultimate Contrarian Indicator: Retail Sentiment
Perhaps the most profound takeaway from today's market action is the power of contrarian psychology. The financial markets are designed to transfer wealth from the impatient, emotional majority to the patient, logical minority.
When Gareth publicly outlined his thesis for shorting oil, the retail crowd's reaction was overwhelmingly negative. Comment sections were filled with certainty that oil was heading higher and that shorting it was a fool's errand. For a professional trader, this isn't a reason to doubt the trade; it's a reason to increase position size.
"When sentiment is 90% against, which means the markets don't pay out those players, it goes the opposite way of the crowd… it is unbelievably accurate, to the point where I honestly don't think I have a better indicator than that," Gareth revealed.
If the crowd is 50/50 on a trade, the sentiment indicator is useless. But when 90% of retail traders are absolutely convinced of a singular outcome, the market almost always does the exact opposite. Why? Because if everyone who wants to buy oil has already bought it, there is no one left to drive the price higher. The moment a negative catalyst hits—like a 7:00 AM social media post about geopolitical talks—the exit door is too small for everyone to fit through, resulting in the violent $101.5 to $85 collapse we witnessed today.
Conclusion: Be the Casino, Not the Gambler
Today's market action perfectly encapsulates the Verified Investing philosophy. While retail traders were panicking over a 7% drop in the S&P 500 or getting blindsided by the collapse in oil and silver, prepared traders were calmly executing pre-planned levels. They banked 8% on Newmont Mining, secured massive profits on the SCO oil short, and bought the S&P futures bounce at major support.
"Can we have a high-probability scenario and put the money on those chips, those chips on the table for those levels, and be the casino instead of the gambler? You're damn right we can," Gareth concluded.
Trading is not about predicting the future with 100% certainty. It is about identifying high-probability setups where technicals, macroeconomics, and market psychology align. By mastering multiple timeframes, ignoring the emotional noise of the crowd, and strictly adhering to chart levels, investors can stop gambling on narratives and start operating like the house. As we navigate the coming weeks of economic data, midterm political maneuvering, and yield curve fluctuations, maintaining this logic-based, emotionless approach will be the ultimate key to profitability.
Trading involves substantial risk. All content is for educational purposes only and should not be considered financial advice or recommendations to buy or sell any asset. Read full terms of service.