My Trading Game Plan Revealed - 03/26/2026: Oil Spike Threatens Markets: S&P 6,500 Test and Nvidia Breakdown Risk

The convergence of geopolitical instability, shifting macroeconomic data, and critical technical levels has created a precarious environment for investors and traders alike. With energy markets flashing warning signs and major equity indices testing pivotal support zones, the need for objective, chart-based analysis has never been greater. In this morning's My Trading Game Plan show, Gareth Soloway, Chief Market Strategist at Verified Investing, dissected the complex web of factors driving current price action, offering a masterclass in separating emotional narratives from technical realities.
The Macro Headwinds: Oil, Inflation, and Economic Stagnation
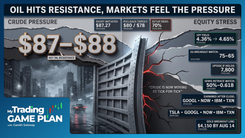
The broader market narrative is currently being hijacked by the energy sector, specifically the alarming price action in crude oil. With oil spiking back toward $95 a barrel, the macroeconomic implications are rippling across asset classes. This surge is heavily tethered to geopolitical tensions, notably the lack of agreement regarding the 15-point plan proposed by the U.S. to Iran, and the expiration of a one-week respite from potential strikes on Iranian power plants.
Furthermore, the continued closure of the Strait of Hormuz is acting as a massive bottleneck for global supply chains. The inverse relationship between oil prices and equity futures was on full display in the overnight session; as oil climbed, S&P 500 futures steadily declined.
"The higher oil stays for longer, the more inflation is going to be pressured," Gareth noted, pointing to the immediate real-world consequences of this energy shock.
The cascading effects of inflation are already manifesting in everyday logistics. The U.S. Postal Service recently requested an 8% price increase for shipping and mailing, directly citing the jump in fuel costs. This is a classic example of cost-push inflation. When the cost of transporting goods rises, those expenses are inevitably passed down to the consumer, impacting food and retail prices across the board.
Beneath the surface of these headline inflation fears lies a weakening economic foundation. The $2 trillion private credit market is currently hemorrhaging, and the labor market is showing severe signs of stagnation. While initial jobless claims remain historically low, actual hiring has ground to a halt. College graduates are struggling to secure entry-level positions, a dynamic exacerbated by companies increasingly implementing AI to replace human capital. We are witnessing a tipping point where middle-income earners are now feeling the severe financial strain that was previously isolated to lower-income demographics.
S&P 500 Technicals: The Path to 6,100
Despite the overwhelming fundamental headwinds, technical analysis requires traders to trade the chart in front of them, not the news on their screens. For the S&P 500, the critical line in the sand is currently 6,500.
"As long as we hold this 6,500 level on the S&P, I'm going to remain with the bias that this down move is due for a little bit longer bounce," Gareth explained.
This near-term bullish bias is a testament to the mechanics of market structure. Markets rarely move in straight lines, and after a sustained downward push, relief rallies are mathematically probable as long as key support holds. However, traders must clearly distinguish between a near-term bounce and a long-term trend reversal.
Gareth's mid-term outlook remains decidedly bearish. If the S&P 500 manages to bounce over the next week or two, it could carve out the right shoulder of a massive head and shoulders pattern. This classic bearish reversal formation would set the stage for a significant rollover, with a mid-year or early third-quarter target of 6,100.
The psychology behind this potential setup is fascinating. A near-term bounce would likely reignite bullish sentiment, drawing retail investors back into the market under the false assumption that new all-time highs are imminent. This influx of late-stage liquidity is exactly what institutional players need to offload their positions before the next major flush to 6,100.
The Debt Burden and the Dollar's "Pathetic" Rally
The bond market is currently flashing its own set of warning signs. The 10-year Treasury yield has recently gained 50 basis points, effectively acting as a phantom rate hike by the Federal Reserve. This upward pressure on yields is directly correlated to rising oil prices and the subsequent inflation expectations.
However, there is a more systemic issue at play: the ballooning U.S. national debt. With the deficit pushing north of $39 trillion and rapidly approaching $40 trillion, the cost of funding geopolitical conflicts and domestic spending is reaching a breaking point. Eventually, the market will face a reality where foreign buyers step away from long-term U.S. debt, fearing either default or severe currency debasement.
This brings us to the U.S. Dollar. While the dollar has seen a slight uptick recently as a safe-haven asset amidst global tensions, Gareth characterized this rally as "pathetic" when viewed through a historical lens.
To understand this, we must look back to the 2022 Russian invasion of Ukraine. During that crisis, the dollar staged a massive, sustained rally. Today, despite the U.S. being directly involved in escalating geopolitical conflicts, the dollar's response has been muted and has already hit technical resistance. This lackluster performance is a glaring bearish signal for the currency's long-term dominance. While de-dollarization is a slow, multi-decade process, the current chart action suggests that the global shift away from the greenback is quietly accelerating, making hard assets increasingly vital for long-term wealth preservation.
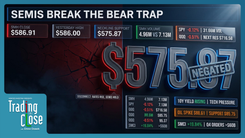
Tech Sector Contagion: Software and AI at a Crossroads
The mega-cap technology stocks, once viewed as invincible safe havens, are now showing severe technical fractures. As a veteran trader, Gareth's eyes are naturally drawn to the software and semiconductor names that have been beaten down the most, as they often provide the most lucrative swing trading opportunities.
Google and Microsoft: Critical Gap Fills
Google is currently testing a crucial pivot support trend line at $291. If this technical floor gives way, the stock opens up to a highly tradable gap fill down at $277, with major structural support waiting at $271. Similarly, Microsoft is on the day-trading radar with a major gap fill just below $367. If the broader market experiences a morning flush, a $2 to $2.50 drop in Microsoft would bring it into a high-probability support zone.
Oracle: The 10% Swing Trade Potential
Oracle provides a perfect example of how quickly market sentiment can shift. Just a few weeks ago, the stock was trading at $171 following an earnings report. It has since plummeted to $144 in the pre-market, bringing it right into a longer-term technical support zone. For swing traders, buying high-quality software names at major support after a severe capitulation often yields a natural relief rally as short sellers cover their positions. A calculated entry here could potentially yield a 10% bounce in a matter of days.
Nvidia and the AI Commoditization Threat
Perhaps the most critical chart in the entire market is Nvidia. The semiconductor giant is currently resting on one of the most well-defined, long-term trend lines in recent market history.
In technical analysis, the more times a trend line is tested and holds, the more significant the eventual break becomes. Because Nvidia has consolidated and rested along this line for so long, a breakdown would release a massive amount of pent-up energy, likely resulting in a violent drop.
Fundamentally, the narrative surrounding Nvidia's absolute monopoly is beginning to crack. Arm Holdings recently announced a new AI chip, and Google has introduced new software that drastically increases memory storage efficiency. This is the natural lifecycle of disruptive technology: innovation leads to monopoly, which inevitably attracts fierce competition, ultimately leading to commoditization. With a market cap hovering near $3 trillion, the law of large numbers dictates that maintaining exponential growth is mathematically nearly impossible.
GE Vernova: The Anatomy of a Topping Tail
While the broader market struggles, GE Vernova (GEV) has been an absolute juggernaut, pushing to all-time highs as a premier play in the small nuclear reactor space. However, parabolic runs eventually exhaust themselves, and GEV has just flashed a textbook technical warning sign.
On the daily chart, GEV printed a massive "topping tail." This occurs when a stock pushes to new highs intraday, only to face aggressive selling pressure that forces it to close near its lows, leaving a long "tail" or "wick" at the top of the candle. This is a definitive bearish reversal signal, indicating that the sellers have violently wrested control from the buyers.
Furthermore, zooming out to the monthly chart reveals a perfect "measured move." By taking the distance of the previous massive four-candle run-up and projecting it from the recent swing low, the target aligns flawlessly with yesterday's high.
"What we call that in technical analysis is a measured move, and there's something subconsciously psychological within us as investors… when that occurs, something triggers in us subconsciously and says, oh, it's kind of completed its full circle," Gareth explained.
Unless GEV can manage a daily close above that topping tail high, the technical probabilities heavily favor that the top is officially in, making it a prime candidate for a short trade or profit-taking.
Commodities and Crypto: Gold, Silver, and Bitcoin
The alternative asset space continues to provide incredible technical setups, particularly as investors weigh the long-term implications of inflation and currency debasement.
Gold and Silver Divergence
Gold has experienced a slight pullback but remains structurally sound. The key level to watch is the $4,300 to $4,400 support zone. As long as gold does not print a daily close below $4,300, the chart favors a short-term bounce back toward the $4,660 pivot high.
Silver, however, is fighting a much tougher technical battle. The metal continues to dance dangerously around the $70 technical support level. If $70 breaks and confirms, the trapdoor opens for a significant flush down to the $50 to $54 range. While this sounds bearish, professional traders view this as a massive opportunity. The $50 to $54 zone represents a generational buying opportunity for core, long-term portfolio additions.
Oil's Bearish Consolidation
Despite the fundamental headlines driving oil to $95, the chart itself remains structurally bearish. Oil is currently forming a parallel channel, acting as an inside bar consolidation pattern following a prior drop. If the geopolitical situation stabilizes—specifically regarding the Straits of Hormuz—and oil breaks below this consolidation channel, the technical target points to a rapid descent back to $70 a barrel.
Bitcoin's Relative Strength
Bitcoin is currently exhibiting fascinating price action. While the S&P 500 has been making short-term lower lows, Bitcoin has been quietly carving out short-term higher lows, bouncing off the bottom of its parallel channel. This relative strength gives Bitcoin a neutral-to-upside bias as long as it remains inside this support zone. However, risk management remains paramount; if Bitcoin breaks and confirms below its lower trend line, the algorithmic selling will likely drive the price swiftly down to the $60,000 level.
Trading Psychology: The "Three a Day" Philosophy
Perhaps the most valuable takeaway from today's market analysis is the mindset required to execute these trades. Retail traders often suffer from the fear of missing out (FOMO), feeling anxiety when a stock moves without them. Professional traders operate on a completely different psychological plane.
"I miss 100 trades a day. I say this to you guys all the time. I'll miss 100 trades every single day. Just is what it is. All I care about is the three I get," Gareth stated, perfectly summarizing the abundance mindset required for long-term profitability.
The market provides infinite opportunities. Missing a breakdown in Nvidia or a bounce in Oracle is irrelevant in the grand scheme of a trading career. The goal is not to catch every move; the goal is to patiently wait for the specific setups where multiple technical factors align, offering a high-probability edge. By securing just two or three high-quality trades a day, a trader can generate substantial, consistent income without the emotional rollercoaster of chasing every headline.
Volatility, whether driven by Middle East tensions, oil spikes, or AI chip announcements, is not something to fear. Volatility creates the price dislocation that technical traders exploit. By stripping away the emotional narratives and focusing purely on the logic of charts, patterns, and measured moves, investors can navigate this treacherous macroeconomic landscape with clarity and precision.
Trading involves substantial risk. All content is for educational purposes only and should not be considered financial advice or recommendations to buy or sell any asset. Read full terms of service.