My Trading Game Plan Revealed - 04/13/2026: Oil Spike From Hormuz Blockade Triggers Semiconductor Selloff and Software Rotation

The weekend brought a fresh wave of geopolitical uncertainty as negotiations between the U.S. and Iran failed to reach a compromise, leaving the markets to grapple with the risk of renewed escalation. With President Trump announcing a blockade of the Strait of Hormuz, the complex interplay between global conflict, energy markets, and algorithmic trading is on full display. In this morning's My Trading Game Plan show, Gareth Soloway, Chief Market Strategist at VerifiedInvesting.com, broke down exactly how these macro events are translating into actionable chart setups, revealing a critical rotation out of high-flying semiconductors and into beaten-down software names.
Geopolitics, Oil, and the S&P 500's Algorithmic Dance
The headline risk over the weekend was substantial. The failure to reach a truce with Iran, coupled with the announcement of a blockade at the Strait of Hormuz, sent immediate ripples through the futures market. The strategic goal of the blockade is clear: to cut off the estimated $2 million per ship that vessels were paying to pass through the straits. As Gareth noted regarding the administration's strategy:
"Essentially, he's trying to not allow Iran to get funding to continue their efforts in the war, all right?"
Initially, this news drove S&P futures down over 1% on Sunday evening. However, the market's reaction perfectly illustrated the push-and-pull of modern trading. Whispers of potential future negotiations within a few days helped equities float off their lows, introducing what Gareth referred to as the "taco factor"—the market's ongoing assessment of the administration's willpower to sustain economic damage, rising oil prices, and inflation to achieve its geopolitical goals.
What is truly fascinating for day traders and swing traders is the mechanical, algorithmic relationship currently dominating the intraday price action. There is a direct, inverse correlation between crude oil and the S&P 500 futures. As oil ticks higher on supply fears, algorithmic trading programs automatically sell S&P futures. When oil pulls back, equities catch a bid. Understanding this inverse relationship is crucial for anyone trading the indices right now.
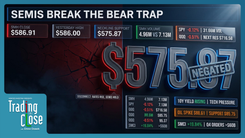
From a technical perspective, the S&P 500 is currently rejecting a major zone of resistance. Following Friday's gap higher that ultimately resulted in a late-day selloff, the index is showing signs of exhaustion. The critical level traders must watch is 6,740. If the S&P 500 registers a daily close below 6,740, technical analysis dictates a high probability of a full gap fill down to 6,615. Should that trapdoor open further, we could see a retest of the recent lows and the middle point of the parallel channel that initiated the massive rally two weeks ago.
As Gareth wisely reminded viewers regarding headline news: "We must let the charts always tell us what the charts are likely to do, versus me making assumptions or you making assumptions on any one in particular headline."
The Semiconductor Exhaustion: The "Napoleon" Setup
One of the most prescient calls from Friday's trading session was the aggressive short signal on the semiconductor sector (SMH). After rallying for seven consecutive days—a classic time count for exhaustion—the charts were screaming that a pullback was imminent. Lo and behold, the semis gapped down this morning.
The technical evidence for a longer-term top in the semiconductors is mounting, driven by two massive chart formations:
1. The Triple-Tap Trendline: The SMH is currently reacting to a massive triple-tap trendline. In technical analysis, these formations often follow a specific rhythm. The first tap results in a minor pullback. The second tap yields a more significant correction. The third tap frequently triggers a major drawdown or the beginning of a bear market. Gareth drew a direct parallel to Bitcoin's macro chart, where a trendline connecting the 2017 highs to the 2021 highs produced this exact same three-tap sequence before a massive crypto winter set in.
2. The 103% Moving Average Extension: Looking at the weekly chart, the semiconductors have reached a mathematical extreme. The sector is currently trading 103% above its 200-period moving average. Remarkably, this exact 103% extension has marked the absolute peak of every major semiconductor rally since 2020.
Gareth used a brilliant historical analogy to explain this concept of mean reversion: "They get too far away again from their supplies, just like Napoleon… ultimately, that's where the army has to or the semiconductors are just pulled back to home base."
When an asset stretches too far from its moving average, the "rubber band" eventually snaps back. While the semis won't crash in a straight line, the technical probabilities strongly suggest that a longer-term top is currently being carved out.
The Great Rotation: Software's Relative Strength
Professional trading isn't just about knowing what to sell; it's about knowing where that capital is rotating. As the semiconductors face historical resistance, the software sector is presenting a compelling, deep-value technical setup.
"I'm shorting the semis, and I'm buying software," Gareth stated, highlighting a classic pairs-trade mentality.
The concept of "relative strength" was on full display this morning. Despite the S&P 500 futures gapping down and the broader market facing geopolitical headwinds, key software names were actually trading higher in the pre-market. When a stock ignores broader market weakness, it is a massive tell that institutional accumulation is occurring at support levels.
Several key software setups were highlighted:
- Adobe: Sitting on massive weekly support, Adobe showed incredible relative strength, trading up over a dollar in the pre-market to $226.50. The technical setup suggests a high-probability bounce with a first target of $250. If momentum continues and it moves to fill the gap above, the secondary upside target sits at $270.
- Salesforce (CRM): Also trading up roughly a dollar in the pre-market, CRM is deeply oversold on both the short-term and long-term timeframes, resting on major weekly support levels.
- Oracle: After perfectly filling a downside gap on Friday, Oracle caught a technical bid and is pushing higher.
- Okta: Perhaps the most dramatic example of sector decimation, Okta was trading at $128 in May 2025—less than a year ago. Today, it sits at $60. After a brutal decline, it is forming a three-bar surge setup and piercing a key trendline, signaling a high probability of a near-term reflex bounce.
It is important to note that these are swing trade setups based on technical extremes, not necessarily ten-year fundamental holds. As the AI narrative evolves, the long-term survival of some software models remains to be seen, but the short-term charts are heavily skewed to the upside.
The U.S. Dollar and Precious Metals Outlook
The currency and commodity markets are also flashing important signals. The U.S. Dollar (DXY) is currently flat, but its broader chart structure is telling a fascinating story of historical polarity.
The dollar has rallied directly into a massive resistance zone between 100 and 101.50. Going back to 2015, this exact zone acted as a stubborn ceiling. Once broken, it became a floor of support. Now that the dollar has fallen back below it, that 100 to 101.50 zone has reverted to heavy resistance, and price is actively being rejected.
Interestingly, despite a major geopolitical conflict—a scenario that typically triggers a massive flight to safety into the greenback—the dollar's bounce has been incredibly meager. This lack of safe-haven demand speaks volumes about the underlying weakness of the currency and suggests lower prices over the next year or two.
In the precious metals complex, the charts are leaning bearish:
- Gold: Opened sharply lower and is forming a bearish continuation pattern. As long as gold fails to reclaim the $5,400 level, the chart implies an eventual rollover. Gareth's macro downside target for gold remains $3,500 per ounce by year-end, which is where long-term accumulation would become attractive again.
- Silver: Currently carving out a textbook bear flag. While this flag could technically drift as high as $82/oz, any price action below $82 keeps the bearish structure intact, implying a higher probability of a breakdown.
Energy Dynamics: Oil Resilience and the Natural Gas Opportunity
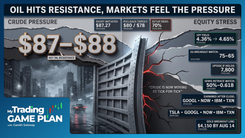
While crude oil is currently acting as the algorithmic trigger for equity selling, its macro outlook remains elevated. Gareth projects that oil will likely sustain a range of $75 to $80 a barrel.
The rationale here is based on strategic global reserves. Countries that have been shocked by recent energy spikes are not going to wait for oil to drop to $50 a barrel to refill their reserves. Once oil dips below $80, the U.S. and other nations will likely begin aggressive reloading, creating a strong floor under the market. This dynamic should keep oil well above the former pre-war baseline of $60 until a true global recession takes hold.
This sustained elevation in oil prices creates a massive secondary opportunity in Natural Gas. On Friday, Gareth initiated a long position in natural gas at a technical double bottom amid extreme oversold conditions.
Beyond the technicals, there is a massive fundamental tailwind developing for natural gas: the AI data center energy crisis. Data centers are facing intense public and political pushback for driving up local energy costs—a reality already hitting consumer utility bills in states like Oregon. As this backlash grows, data centers will be forced to seek cheaper, alternative energy sources to fuel their massive power requirements. Natural gas is perfectly positioned to become the bridge fuel of choice for the AI revolution.
Bitcoin's Resilience and the Earnings Horizon
In the cryptocurrency space, Bitcoin demonstrated notable resilience. While it took a brief tumble yesterday when news of the failed geopolitical talks broke, it quickly found its footing.
On the micro timeframe, Bitcoin successfully held a key short-term level around $70,500. Looking at the broader structure, the bullish thesis remains entirely intact as long as Bitcoin maintains support in the $68,000 to $65,000 zone. If this floor holds, the charts point toward a retest of $76,000, with the potential to push toward the $80,000 psychological barrier.
As we navigate these geopolitical headlines, we must also prepare for a shift in market focus. Earnings season is officially underway, with Goldman Sachs reporting this morning. Later this week, heavyweights like Netflix and Taiwan Semi will step up to the plate.
The critical factor to watch during this earnings cycle is corporate guidance. Will the recent shock in oil prices and geopolitical instability cause executives to lower their forward-looking estimates? If guidance weakens due to energy costs, it could serve as the fundamental catalyst that causes the broader stock market to break through the technical trapdoors discussed earlier.
Conclusion: The Discipline of the Chart
Today's market environment is a minefield of emotional triggers. Between war headlines, blockades, and volatile energy prices, it is incredibly easy for retail investors to get swept up in the narrative and make impulsive decisions.
However, as Gareth Soloway's analysis proves, the charts already know the news. The semiconductor exhaustion was visible before the weekend headlines hit. The software rotation was telegraphed by relative strength. The S&P 500's rejection happened precisely at predefined technical resistance.
"A good trader or investor is always tuned in to understand the underlying mechanics of what is driving the market," Gareth reminded his viewers.
By stripping away the emotion, ignoring the talking heads, and focusing purely on probabilities, moving average extensions, and multi-factor technical support, traders can find incredible opportunities even in the most chaotic macro environments. Whether you are looking to short overextended tech, buy beaten-down software, or navigate the complex energy trade, the game plan remains the same: trust the charts, manage your risk, and let the probabilities play out.
Trading involves substantial risk. All content is for educational purposes only and should not be considered financial advice or recommendations to buy or sell any asset. Read full terms of service.