My Trading Game Plan Revealed - 04/15/2026: S&P 2.5% from Top, Semiconductor RSI Divergence and Mega Cap Short Setups

The financial markets are currently exhibiting a classic display of late-stage momentum, characterized by a staggering 11-day winning streak on the NASDAQ and a relentless upward grind that has caught many market participants off guard. As retail investors succumb to the fear of missing out (FOMO) and previously short-positioned hedge funds scramble to cover their tracks, the broader indices are flashing critical warning signs.
In this morning's My Trading Game Plan show, Gareth Soloway, Chief Market Strategist at VerifiedInvesting.com, dissected the underlying mechanics of this rally. Moving beyond the euphoric headlines, he revealed the stark technical realities, the geopolitical mirages propping up equities, and the high-probability swing trade setups that professional traders are currently executing.
The S&P 500: A Precarious 2.5% Upside
The S&P 500 has staged a tremendous rally, blowing through multiple resistance levels with what appears to be unshakeable bullish momentum. However, a step back to view the broader technical landscape reveals a market approaching a massive historical ceiling.
The index is currently staring down its next key resistance zone, which aligns with its all-time high: the area between 6,980 and 7,000. This 7,000 level is particularly significant, as it marks the exact point the market pierced back in January before suffering a sharp downward reversal.
While retail investors are treating this current price action as a carbon copy of the massive rally that began in April 2025, the technical context is vastly different. During the 2025 bottom, the S&P 500 was sitting at the low end of its macro parallel channel, offering massive upside potential. Today, the index is dangerously close to the upper boundary of that same channel.
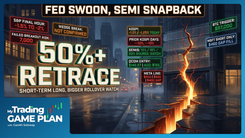
"Look at how high we are and look at how much upside is left until we slam into that parallel trend line up there. Only about 2.5%," Gareth noted, highlighting the skewed risk-to-reward ratio currently facing long investors.
This is where the psychology of amateur versus professional trading diverges sharply. Novice traders often look at strong momentum and assume a breakout is inevitable. Professional traders, however, operate strictly on mathematical edges. As Gareth explained: "A good trader doesn't hope and dream. A good trader uses technical support and resistance to make high probability decisions." Assuming a market will effortlessly slice through a multi-year parallel resistance line is a gamble, not a trading strategy.
The Oil Mirage and Premature Pricing
To understand the current equity rally, one must look closely at the energy markets. The S&P 500's recent upside has been heavily influenced by a sharp pullback in crude oil prices. Yesterday, oil prices dropped near $90 a barrel, and overnight they plummeted below $87 before bouncing back to $92.
This drop in oil has acted as a psychological buoy for the stock market. Lower energy prices generally translate to lower inflationary pressures and reduced costs for consumers and corporations alike. However, the reason for this drop in oil is where the danger lies.
The market has preemptively priced in a diplomatic resolution to the ongoing geopolitical tensions between the US and Iran, specifically betting on the reopening of the Strait. Yet, the reality on the ground tells a completely different story. The Strait remains blockaded, and Iran is currently enforcing a staggering $2 million per tanker fee for any non-allied ships attempting to pass through.
When financial markets price in a geopolitical solution that has not yet materialized, they create a massive vulnerability. If the conflict drags on and the anticipated diplomatic breakthrough fails to occur, the subsequent repricing of oil could trigger a violent retracement in equities. Furthermore, even if oil merely stabilizes at $90 a barrel for the next few months, the cumulative economic damage of sustained high energy costs will eventually erode corporate margins.
Semiconductor Euphoria and the RSI Divergence
Perhaps the most alarming technical signals in the current market are flashing within the semiconductor sector. The space has experienced a meteoric 25% move up in just the last two weeks. To put the sheer scale of this rally into perspective, mega-cap tech stocks have added a mind-boggling $6 trillion to the economy in that same short timeframe.
While price action is making higher highs—a traditional hallmark of an uptrend—the internal momentum of the sector is telling a much darker story. Looking at the weekly chart for semiconductors, a glaring bearish divergence has formed on the Relative Strength Index (RSI).
While the price has pushed to new all-time highs, the weekly RSI is making lower lows. This technical phenomenon is one of the most reliable leading indicators of trend exhaustion.
"The relative strength index, it tells you the underlying pressure of buyers is being diminished while institutions generally are starting to unload heavily into this move," Gareth explained.
This divergence perfectly illustrates the transfer of wealth that occurs at the top of market cycles. Retail investors, driven by FOMO and headline hype, are aggressively buying the highs. Meanwhile, smart money institutions are using that retail liquidity as an exit strategy, quietly unloading their positions. While a weekly RSI divergence can take weeks to fully play out, it serves as a massive red flag that the current semiconductor rally is structurally unsustainable.
Priced for Perfection: The Earnings Reality Check
As we navigate the heart of earnings season, the concept of being "priced for perfection" is taking center stage, particularly in the semiconductor space. When stocks experience historic, triple-digit percentage rallies, the market's expectations become mathematically impossible to satisfy.
Take ASML, for example. In April 2025, the stock was trading at $580. By yesterday's close, it had skyrocketed to over $1,500—an astonishing 200% rally in a single year. When ASML reported earnings, they actually delivered very strong results, beating on revenue and even raising their full-year guidance. However, because their Q2 guidance was slightly weak, the stock immediately sold off, dropping 2% to 3%.
When a stock has rallied 200%, beating estimates is no longer enough. The company must shatter expectations across every conceivable metric. If there is even a slight blemish in the report, the stock will fall.
This dynamic casts a long shadow over upcoming earnings reports, particularly for Taiwan Semiconductor (TSM). Known as the behemoth of the sector with a market cap well over a trillion dollars, TSM has rallied from $134 in April 2025 to a current level of $381. Their upcoming earnings report will be a critical litmus test for the entire tech sector. If TSM fails to deliver absolute perfection, it could serve as the catalyst that triggers the broader tech pullback the RSI divergence is currently predicting.
Strategic Short Setups in Mega-Caps
Given the extreme overextension in the market, Gareth has shifted his portfolio positioning. While maintaining select long exposure in software and specific Chinese equities, the majority of his swing trading capital is now deployed on the short side, targeting mega-cap tech names that have hit critical resistance levels.
Micron's Unsustainable Run
Micron presents a prime example of market irrationality. The stock has rallied 50% since March 31st. While a 50% move in two weeks might be normal for a small-cap speculative stock, Micron is a half-trillion-dollar company. Adding hundreds of billions of dollars in market cap in just 14 days is historically unprecedented. Gareth initiated a short position on Micron yesterday after hours as it slammed into a double-top resistance level, and the trade is already up $10.
Google and Amazon at Resistance
Google (Alphabet) has seen a massive move from $270 to $330—a 20% plus rally for a multi-trillion-dollar entity. As the stock pushed directly into a major technical resistance zone, it provided a textbook entry for a short position. The swing trade target for this pullback is the $300 to $305 level. Similarly, Amazon pierced a beautiful technical resistance level yesterday before starting to pull back, offering another high-probability shortable level for disciplined swing traders.
Nvidia's Technical Extension
Even market darling Nvidia is not immune to gravity. The stock has pushed right into a massive resistance zone defined by previous high pivots. Based on technical extension measurements, Nvidia is primed for a pullback into its near-term support range, representing roughly a $10 drop in the coming days.
The key to executing these trades is understanding the time horizon. As Gareth emphasized, these are swing trades. The goal is not to predict where Google or Nvidia will be in 2027, but rather to capitalize on the high-probability technical retracements that must occur over the next one to two weeks as these overbought conditions unwind.
Commodities and Crypto: The Macro Bear Flags
The technical analysis extends beyond equities, revealing fascinating macro patterns across commodities and cryptocurrency. A unified theme is emerging across Gold, Silver, and Bitcoin: the formation of macro bear flags.
Gold has been pulling back, currently facing short-term resistance around $4,850, with the next major ceiling at $5,000. While the near-term action might appear neutral to slightly bullish, the longer-term macro pattern is printing a bearish inside bar. This suggests that after a period of sideways digestion, the ultimate resolution will be to the downside.
Silver is painting a nearly identical picture. After creeping close to the $82 resistance level, it has begun to pull back. The chart shows a sharp drop followed by a small, prolonged grind higher—the textbook definition of a bear flag. This indicates the market is merely digesting the previous downward momentum before rolling over to new lows.
Bitcoin is following this exact same macro blueprint. The cryptocurrency rallied yesterday, hitting the precise short-term pivot top resistance at $76,000 that Gareth had previously identified. If Bitcoin manages to form a short-term bull flag here (characterized by sideways chop), it could see a brief push to the $80,000 to $85,000 level. However, just like gold and silver, Bitcoin is trapped within a much larger macro bear flag. The overarching technical structure points to an eventual flush to the downside, regardless of near-term noise.
In the energy sector, Natural Gas (UNG) remains a quiet outlier. Currently hovering around a lower wedge pattern, Gareth maintains a small long position. However, risk management remains paramount; if the pattern breaks down, the next major support pivot sits at $2.36.
Conclusion: Logic Over Emotion
The current market environment is a masterclass in the battle between retail emotion and institutional logic. With the Nasdaq on an 11-day tear, mega-caps adding $6 trillion in market cap in two weeks, and retail investors fully consumed by FOMO, the psychological pressure to chase the rally is immense.
However, the charts strip away the emotion and reveal the truth. The S&P 500 has a mere 2.5% upside before hitting macro resistance. Semiconductors are flashing glaring weekly RSI divergences. The oil market is pricing in a geopolitical peace that does not exist. And trillion-dollar companies are priced so perfectly that even strong earnings reports are met with selling pressure.
Successful trading is not about blindly following the herd or hoping a stock breaks through resistance. It is about identifying high-probability setups, managing risk, and executing trades based on cold, hard technical data. As the market eventually shifts its focus away from the oil narrative and back to the underlying macroeconomic reality, those who traded based on logic and levels will be the ones left standing.
Trading involves substantial risk. All content is for educational purposes only and should not be considered financial advice or recommendations to buy or sell any asset. Read full terms of service.