My Trading Game Plan Revealed – 05/20/2026: Oil, Yields & Nvidia Drive a Critical Market Test

The financial markets are a constant battleground between logic and emotion, where hype and narratives often lure retail investors into devastating traps. To survive and thrive, traders must strip away the noise and rely on the cold, hard data provided by technical analysis. In this morning's My Trading Game Plan Revealed show, Gareth Soloway, Chief Market Strategist at Verified Investing, outlined a masterclass in probability-based trading.
With Nvidia's blockbuster earnings on deck tonight, a wave of retail reports landing today and tomorrow, an ongoing US-Iran conflict keeping oil and yields elevated, and major indices testing historical trend lines, the current market environment demands precision. Today's analysis dives deep into the technical setups, historical parallels, and psychological discipline required to navigate these turbulent waters, ensuring you operate like the casino rather than the gambler.
The Macro Foundation: Oil, Yields, and S&P 500 Futures
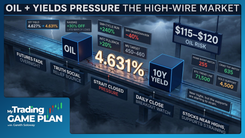
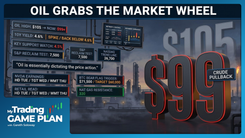
To understand where the stock market is heading, you must first look at the foundational elements driving institutional money flow: crude oil and the 10-year Treasury yield. With the Strait of Hormuz still effectively closed and US-Iran negotiations on a knife's edge, these two assets are not just linked — they are the daily metronome for every other risk asset.
As Gareth explained this morning, the relationship is straightforward but vital: "The higher oil goes, inflation expectations go up. Therefore, the interest rates go up. When oil comes down, inflation expectations come down, and then the 10-year yield can come down."
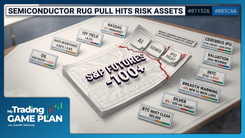
Currently, the 10-year yield is hovering around 4.66%, near its highest levels in more than a year after breaking decisively above the critical 4.5% level. It eased slightly today after President Trump called off a planned strike on Iran following appeals from Saudi Arabia, Qatar, and the UAE — the same headline that pulled WTI crude back toward $102–$103 from recent highs above $107. This dual retreat in oil and yields provided the exact catalyst needed for the S&P 500 futures to trend neutral-to-higher in the pre-market, setting up a 25 to 30 point up start at the opening bell.
The Oil Wedge Pattern: Pressure is Building
While today's pullback in oil is giving equities room to breathe, the longer-term chart reveals a massive wedge pattern forming. In technical analysis, a wedge pattern represents a compression of price action — buyers and sellers are fighting within an increasingly narrow range.
Wedges are notorious for their explosive resolutions. As price gets squeezed toward the apex of the wedge, pressure builds to a boiling point. When the breakout or breakdown finally occurs, it typically results in a violent, sustained move in that direction. With the Strait of Hormuz still functionally shut and Iran's negotiating posture unsettled, the resolution of this wedge will likely dictate the next major trend for inflation expectations, the 10-year yield, and consequently, the broader stock market.
S&P 500 Technicals: The Power of Polarity
Looking at the S&P 500 daily chart, the index is navigating a fascinating technical landscape after closing yesterday at 7,353. After breaking out to new highs, the market is relying on a core tenet of technical analysis: the principle of polarity. This principle states that once a major resistance level is broken, it flips to become major support.
For the S&P 500, the critical line in the sand is 7,000. If the market experiences a pullback — perhaps triggered by a fresh Middle East escalation, an earnings disappointment from Nvidia, or another leg higher in yields — 7,000 serves as the first major bounce level. Traders watching the short-term resistance trend lines above must keep this 7,000 level mapped on their charts as the ultimate safety net and potential high-probability buy zone.
The NASDAQ 100: Historical Trend Lines and Parallels
While the S&P 500 commands attention, the NASDAQ 100 (QQQ) chart is currently displaying one of the most compelling technical setups in the market. Gareth highlighted a specific, multi-year trend line that carries immense historical weight.
This upper resistance trend line connects the absolute market peaks of the last several years. It marks the highest point in 2018, which immediately preceded a brutal 22% drawdown in the NASDAQ. It also connects to the euphoric high of 2021, which was followed by a devastating 37% peak-to-trough collapse. The NASDAQ is now pressing right back into this exact same historical trend line.
Validating the Trend with Parallel Channels
What makes this resistance line truly significant is its geometric validation through parallel channels. As Gareth noted: "Parallels are helpful because they kind of confirm that your trend line is accurate… when you have a parallel that marks up or aligns at other points on the chart to that same trend line, it gives you credence to understand you probably have found something very, very significant here."
By drawing a parallel line off this upper resistance, it perfectly aligns with the most extreme panic bottoms of the last decade: the tariff sell-off low in 2025 and the bear market low in 2022. This flawless parallel channel confirms that the current upside resistance is not arbitrary — it is a mathematically validated boundary that algorithms and institutional traders are watching closely. If the NASDAQ rallies into this line, it presents a formidable barrier that warrants extreme caution for bulls.
Navigating Nvidia: The Danger of Earnings Gambles
The entire financial world is holding its breath for Nvidia's fiscal Q1 2027 earnings report after the closing bell tonight. With the stock trading around $222 — within striking distance of its $236 all-time high — analysts are looking for roughly $78 billion in revenue and $1.76 EPS, and the options market is pricing in a move of about 6.5% in either direction. While the hype machine is in overdrive and narratives are running wild, professional traders approach these binary events with cold calculation.
Gareth gives a slight edge to Nvidia moving higher on what is expected to be an "epic report," but he issued a stern warning about the realities of holding through earnings announcements. Earnings create massive, unpredictable volatility.
"I'm not going to pretend to know the future and I'm not buying Nvidia ahead of earnings or shorting it ahead of earnings," Gareth explained. "Even if you have a 55% chance of being right, if you're wrong, you can lose a lot on earnings."
Mapping the Post-Earnings Battleground
Instead of gambling on the outcome, the Verified Investing approach is to map out the extreme levels where the reward heavily outweighs the risk after the initial reaction.
The Upside Resistance: If Nvidia posts a blowout quarter and surges higher, the chart reveals a beautiful, parallel-confirmed trend line resting between $240 and $245 — just above the recent $236 high. This line has been respected flawlessly in the past, acting as both rejection resistance and re-accepted support. A euphoric spike into the $240 to $245 zone would represent a high-probability shorting or profit-taking opportunity.
The Downside Support: Conversely, if the market uses the earnings as a "sell the news" event, traders must look for structural support. Gareth identified a critical gap fill and pivot low resting between $200 down to $196.50. Gap fills act as magnetic support zones because they represent unfilled orders and psychological reset points. If Nvidia were to crater and pierce $200, stepping in around $196.50 offers a prime, high-probability bounce trade in the after-hours or following session.
The Retail Earnings Parade: Home Depot, Target, TJX, and Lowe's
Earnings season follows a distinct rhythm: banks kick things off, big-cap tech dominates the middle, and retailers close out the cycle, providing a final pulse check on the consumer.
Home Depot reported yesterday morning, posting Q1 sales of $41.8 billion (+4.8% YoY) with diluted EPS of $3.30 — results management called "in line with our expectations." The muted reaction is bleeding into peer Lowe's today.
Target, TJX, and Lowe's all report this morning. Target's price action has been a relative non-event so far, trading slightly down but remaining above yesterday's lows. For day traders, a lack of volatility means a lack of opportunity. However, swing traders should keep Target's extreme levels mapped: a significant flush would find support around the $110 to $109 pivot area, while a massive rally would face resistance near $144.
TJX, currently trading around $150 ahead of its release, presents a setup worth watching post-print. While not actionable until earnings settle, the daily chart shows a beautiful upper trend line. If the stock grinds higher over the next week or two and tags that line near $155, it becomes a textbook short setup.
Lowe's is trading fractionally lower this morning, mirroring the pressure seen in its peer Home Depot's post-earnings drift. The actionable level for Lowe's rests at a major pivot low around $206. If the stock flushes into $206 during intraday trading, it creates a compelling double bottom setup for a day trade bounce.
Ultimately, these reports are the opening acts for the true retail heavyweight: Walmart, which reports tomorrow morning (Thursday, May 21) and will likely dictate the broader sector's momentum.
Commodities and Crypto: Taking Profits and Watching Flags
The commodity and cryptocurrency markets are flashing their own unique technical signals, requiring a disciplined approach to risk management and pattern recognition.
Natural Gas: The Discipline of the Take-Profit
A few weeks ago, Gareth provided a natural gas trade setup that executed perfectly. With Henry Hub futures trading around $3.10 — up roughly 15% over the past month — he announced he had taken profits today, securing a gain of over 10%.
This highlights a crucial psychological component of professional trading. When a target is hit — or comes "close enough for government work" — you take the money. As Gareth noted, exiting a trade doesn't mean the asset can't go higher; it means the risk-to-reward ratio is no longer optimal. Securing a 10% gain in a few weeks while eliminating the risk of a pullback is the hallmark of consistent, profitable trading.
Gold and Silver: Testing Critical Support
The precious metals sector is at a critical juncture. Gold broke key support yesterday and is currently trading right around the $4,500 level, well off the recent push above $4,660. The technical question now is whether this breakdown confirms, or if gold can recapture the level. If the breakdown is confirmed, the next major downside target and potential buy zone rests at the pivot low of $4,100. Traders who attempt to short this breakdown must utilize strict stop-losses if the price breaks back above resistance.
Silver is exhibiting similar weakness, having broken a key up-sloping trend line yesterday. Just like gold, traders must watch today's close to see if the breakdown confirms or if the metal can stage a recapture.
Bitcoin: The Bear Flag Breakdown Level
Bitcoin is trying to bounce today from levels near $76,500 — its lowest since May 1 — largely riding the coattails of the broader stock market's strength. However, it continues to underperform the NASDAQ.
Months ago, Gareth accurately called the upside resistance target for Bitcoin in the $80,000 to $85,000 zone. After tagging that range, Bitcoin has since pulled back below it and is now consolidating in what increasingly looks like a classic bear flag pattern. A bear flag consists of a sharp drop followed by a slow, upward-sloping consolidation channel. It typically resolves with a breakdown that mirrors the initial drop.
Currently, Bitcoin is stuck in "wait and see" mode, trapped between the flag's resistance and support. The critical line in the sand on the downside is $71,500. If Bitcoin breaks below $71,500, the bear flag triggers, opening the door for significant downside. Until that line breaks, or the upper resistance is cleared, the risk-to-reward ratio remains murky, and professional traders will simply sit on their hands.
The Psychology of Probability-Based Trading
The overarching theme of today's market analysis is the absolute necessity of emotional control and probability-based thinking.
"Technicals give us probabilities," Gareth reminded viewers. "Probabilities help us make decisions that essentially make us the casino versus the gambler."
The modern financial landscape is designed to trigger your emotions. Social media platforms are echo chambers of extreme euphoria and apocalyptic panic. Financial news networks rely on sensationalized narratives — from Iran headlines to Nvidia hype cycles — to generate clicks and viewership. If you allow these external forces to dictate your trading, you are playing the role of the gambler, relying on luck and emotion rather than edge.
Technical analysis serves as the ultimate "de-clouding" mechanism. It strips away the hype surrounding tonight's Nvidia earnings report and replaces it with actionable levels at $240 and $196.50. It ignores the panic of a market pullback and simply points to the S&P 500 support at 7,000. It removes the greed from a winning natural gas trade and forces you to lock in a 10% profit when the target is reached.
By mapping out your levels in advance — knowing exactly where you will buy, where you will sell, and where you will stop out — you remove the need to predict the future. You don't need to know if the oil wedge will break up or down, or whether Trump's pause on Iran holds; you only need to know how you will react when the chart moves.
Conclusion: Trading the Plan
As we navigate the remainder of this busy week, the roadmap is clear. The interplay between oil and the 10-year yield — both still heavily influenced by the unresolved US-Iran conflict — will continue to act as the macro metronome for equity markets. The S&P 500 and NASDAQ 100 are dancing around historic technical levels that will dictate the broader trend. Individual names like Nvidia, Target, and Lowe's offer precise, level-to-level trading opportunities, provided you have the patience to let the price come to you.
The market will always offer a new puzzle to solve. Every candlestick, every gap up, and every trend line touch provides a new piece of data that shifts the probabilities. By remaining disciplined, ignoring the noise, and trusting the charts, you position yourself to capitalize on the market's inevitable overreactions. Stick to the data, respect your levels, and always trade the plan.
Trading involves substantial risk. All content is for educational purposes only and should not be considered financial advice or recommendations to buy or sell any asset. Read full terms of service.