My Trading Game Plan Revealed - 05/21/2026: Oil Surge and Rising Yields Pressure Stocks Nvidia $5.7T Valuation and SpaceX IPO Flash Warning

The intersection of geopolitical tensions, shifting macroeconomic data, and blockbuster corporate earnings has created a complex web for traders to navigate this week. With the energy markets reacting to international diplomacy and tech giants facing sky-high expectations, understanding the technical breadcrumbs left by institutional money is more critical than ever. In this morning's My Trading Game Plan Revealed show, Gareth Soloway, Chief Market Strategist at VerifiedInvesting.com, broke down the exact levels, patterns, and psychological indicators that are driving the current market action.
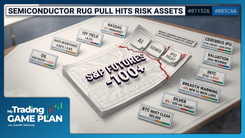
From a massive $5.4 trillion valuation in the semiconductor space to a glaring institutional warning sign hidden within a highly anticipated IPO filing, today's analysis provides a masterclass in reading the tape. Here is a deeper dive into the key themes, technical setups, and strategic outlooks discussed in today's show.
The Macro Pressure Cooker: Oil, Iran, and Yields
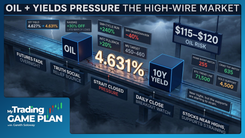
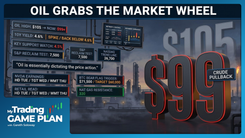
The broader market open was dictated largely by overnight developments in the energy sector. Oil has pushed back above the critical $100 a barrel threshold, driven by geopolitical friction. While markets had previously priced in the possibility of a U.S. deal, comments this morning from the Supreme Leader in Iran—stating that enriched uranium will not leave the country—have created a major sticking point in negotiations.
As soon as this news broke, oil surged, Treasury yields spiked, and equity futures took a hit. This immediate intermarket correlation highlights a crucial dyn
amic: in the near term, the 10-year Treasury yield is intimately tied to inflation expectations, which are currently being driven by oil prices. While long-term yields are generally dictated by national debt levels, the immediate fluctuations are reacting to the pump.
From a technical perspective, oil is forming a massive wedge pattern. As Gareth explained, this formation acts like a coiled spring:
"…when you have a wedge, it basically puts pressure, more and more pressure builds. And when you break, you don't just break a little bit. You break massively one way, or if you break to the downside, you break massively to the downside."
Traders must watch this wedge closely. A breakout to the upside could send shockwaves through the inflation data, further propping up yields and putting heavy downside pressure on the broader stock market.
S&P 500 and NASDAQ: The Casino Approach to Probabilities
The major indices are currently sitting at pivotal technical junctures. The S&P 500 posted a solid 1.08% gain yesterday, but it is now interacting with a major trend line that will dictate the next macro move. The technical question is simple but profound: will the index push up to make a higher high above 7,500, signaling a resumption of the bull move? Or will it form a lower high and break down below the recent low of 7,330?
The NASDAQ is facing a similarly critical test, interacting with a massive, multi-year trend line that dates back to 2018 and runs through the bull market high of 2021. This level was tagged just one week ago, and traders should be watching for reversal signals—specifically topping or bottoming tails—to indicate institutional intent.
This is where the psychology of trading becomes paramount. Retail traders often overcomplicate their charts with endless indicators, but professional trading is about stripping away the noise and focusing on probabilities. As Gareth noted:
"…the charts, as we always say, remember, charts are probabilities, and it's giving us insight into human psychology, which gives us breadcrumbs to what the most probable outcome is."
He further emphasized the mindset required for long-term success:
"I am the casino. I'm not the gambler. We know if enough gamblers come into a casino, the casino is going to make money. But again, can I be the casino where if enough gamblers come in, I make money, right?"
By waiting for confirmation at these key levels—whether it's a break of 7,500 or a failure at 7,330—traders can position themselves on the side of the casino, letting the probabilities play out over time.
Tech and AI: Navigating Sky-High Expectations
The artificial intelligence narrative continues to dominate individual stock action, but the market's reaction to earnings is revealing a shift in how these companies are being valued.
Nvidia: The Weight of a $5.4 trillion Valuation
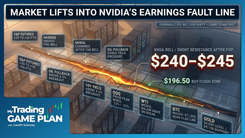
Nvidia reported fantastic earnings yesterday, beating on both revenue and earnings while showcasing incredible profitability. However, the stock's reaction was decidedly flat, whipping around in after-hours trading before settling. When a company reaches a staggering $5.4 trillion valuation near all-time highs, the expectations become nearly impossible to exceed. The market prices in perfection, and even a flawless earnings report can trigger a "sell the news" event.
Technically, Nvidia offers several distinct levels for nimble traders. In the after-hours session, the stock dropped to exactly $216—a perfect tag of a previous high pivot—before bouncing. For aggressive day traders, a retest of $216 could offer a quick opportunity. A slightly lower, secondary aggressive level sits at the gap fill of $211. For those looking for a more substantial swing trade, patience is required; the $196 level is where the chart becomes truly compelling. On the upside, any rally into the $241 to $242 trend line resistance zone would serve as a prime shorting opportunity.
Intuit: The AI Disruption Reality
While Nvidia sells the picks and shovels of the AI gold rush, other software companies are facing the disruptive reality of the technology. Intuit suffered a massive ~18-19% drop following its earnings. The narrative is shifting rapidly: consumers are increasingly turning to AI to handle their taxes, bypassing traditional software solutions.
Despite the fundamental headwinds, technical traders trade the chart, not the news. Intuit is approaching a massive historical support level from 2019 and 2020 right at the $300 even number. If the stock flushes down to $300, it presents a highly probable day trade bounce, and potentially a swing trade, as historical memory and institutional buy orders often cluster at these major psychological round numbers.
Quantum Computing and Government Contracts
On the other end of the tech spectrum, IBM saw a significant pop on news that the government is awarding contracts for supercomputers. This government interest is also spilling over into smaller quantum computing stocks like Righetti and QBTS. However, chasing these massive pops is a gambler's game. For IBM, which has been heavily beaten down, the only actionable level is a day-trade short at $252. Discipline dictates that we do not chase the hype, but rather wait for the chart to provide a low-risk entry.
The Tale of Two Economies: Retail Earnings Divergence
One of the most fascinating takeaways from this morning's analysis is the stark divergence in the retail sector, perfectly illustrated by the earnings reactions of Ralph Lauren and Walmart. This divergence paints a clear picture of the current macroeconomic reality: we are living in two different economies.
Ralph Lauren experienced a great rally on its earnings report. As a high-end retailer, its customer base is largely insulated from the inflationary pressures squeezing the middle and lower classes. These consumers are heavily invested in the stock market, which remains near all-time highs. Because they are experiencing the "wealth effect" of a booming portfolio, they continue to spend on luxury goods. Technically, Ralph Lauren is approaching interesting resistance. Day traders can look for a short setup around $375, while swing traders should wait for the major trend line at $400.
Conversely, Walmart experienced a beautiful technical sell-off today. While their earnings were acceptable, the underlying data reveals a struggling consumer. People are trading down from more expensive stores to shop at Walmart due to inflation, but simultaneously, the lowest-income consumers are getting priced out of Walmart entirely. Given Walmart's stretched valuation, this fundamental weakness triggered a sharp drop. The day trade bounce zone sits between $119 and $118, while a true swing trade wouldn't be viable until the stock reaches the $100 level.
This retail divergence is a critical breadcrumb for investors. It confirms that while the headline indices may look strong, the underlying consumer economy is fracturing.
The SpaceX IPO: An Institutional Warning Sign
Sometimes, the most important market signals don't come from a chart, but from corporate actions. Yesterday, SpaceX filed its S1, moving one step closer to going public. Crucially, the timeline for this highly anticipated IPO was moved up by two to three weeks, from the end of June to likely June 12th.
Why does this matter? Because the major institutions underwriting this IPO are rushing to get it to market.
When the smartest money on Wall Street accelerates an IPO timeline, it is often because they are concerned that market conditions are nearing a top. They want to ensure they can offload shares and secure funding while the liquidity and risk appetite are still present. If institutions are rushing to beat a potential market downturn, retail investors should take note. It suggests that the big money is likely positioning as net sellers in the broader market.
This news had a direct impact on Rocket Lab, which fell on the realization that it announced a $3 billion stock sale program, causing dilution concerns. Rocket Lab has had a monster run, and while the pullback is notable, the first viable technical level to look for a bounce isn't until the $100 price point, where a previous pivot high resides.
Commodities and Crypto: Key Technical Breakdowns
The commodities and cryptocurrency markets are providing equally compelling technical setups, requiring strict adherence to trend lines and support levels.
Gold and Silver
Gold managed to recapture its trend line yesterday, but is showing weakness by coming back in today. The key is to wait for confirmation. If gold confirms a breakdown below this critical level, the technical target points to a flush down to $4,100.
Silver, meanwhile, respected its trend line perfectly yesterday, failing to recapture it. It has not yet confirmed a breakdown, but if it does, the downside target is a clear drop to the $66 to $64 range. The precision of these trend lines reinforces the importance of waiting for daily closes to confirm directional moves.
Natural Gas and Deere
Patience pays off in trading. Natural gas experienced a beautiful retrace yesterday after hitting its upside target. Traders who followed the discipline to unload positions earlier in the week are now safely on the sidelines, acting as spectators while the market figures out its next move.
Similarly, the agricultural equipment giant Deere is flashing a warning sign. Despite a minimal initial reaction to earnings, the stock is forming a textbook bear flag pattern—a down move followed by an inside bar consolidation. If Deere fails to recapture its technical support line, it could trigger a multi-week, multi-month breakdown toward the $500 even number area.
Bitcoin's Risk Correlation
Bitcoin continues to trade in tandem with the broader stock market's risk appetite. Yesterday, with equities up, Bitcoin was up; today, with equities under pressure, Bitcoin is pulling back. The cryptocurrency remains trapped within a well-defined parallel channel. Until it breaks out above resistance or breaks down below support, the highest probability play is to remain neutral and wait for the chart to force a directional hand.
Conclusion: Discipline in a Complex Market
Today's market environment is a perfect storm of geopolitical catalysts, shifting consumer economics, and stretched tech valuations. Whether it is the pressure cooker wedge in oil, the $5.4 trillion expectations on Nvidia, or the institutional tell of the accelerated SpaceX IPO, the market is leaving clear breadcrumbs for those willing to look.
The overarching lesson from today's My Trading Game Plan Revealed is the absolute necessity of discipline. By treating the market like a casino—waiting for high-probability setups at exact levels like Intuit at $300, Walmart at $119, or the S&P 500's reaction to 7,330—traders can remove emotion from the equation.
You do not have to catch every move. You do not have to trade every earnings report. By letting the charts dictate your actions and understanding the psychological forces driving the tape, you can position yourself on the right side of probability. Stay patient, trust your levels, and let the market come to you.
Trading involves substantial risk. All content is for educational purposes only and should not be considered financial advice or recommendations to buy or sell any asset. Read full terms of service.