My Trading Game Plan Revealed - 09/02/2026: Yields and Oil Drive Stocks Ahead of Fed; S&P 7570 Key Level

The weakest labor number of the morning may not be the most important input for stocks.
ADP reported that private employers added 38,000 jobs in August, below expectations and softer than July. The Federal Reserve now has another labor-market data point ahead of its September 15-16 meeting. But on Gareth Soloway's charts Wednesday morning, equities were responding much more directly to two other markets: crude oil and Treasury yields.
His framework is simple:
“Yields and oil up, markets down. Yields and oil down, markets up.”
That relationship is the key to the session.
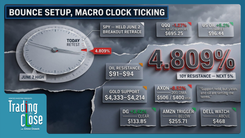
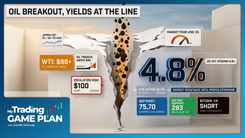
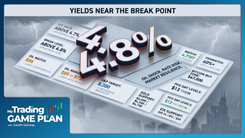
The U.S. 10-year yield pushed through 4.8% as the global bond selloff intensified, while crude remained elevated following renewed U.S.-Iran tensions. Stocks weakened as both moved higher. When oil reversed and yields backed away from their highs, equity futures recovered with them.
For equities, that makes the next question less about whether Wednesday's economic data was good or bad and more about whether oil and yields can break the resistance they are testing.
The S&P 500 Has One Level That Changes the Read
The S&P 500 remains close to its highs despite a difficult combination of elevated oil prices and a 10-year Treasury yield pressing the 4.8% area.
Gareth's line in the sand is 7,570.
Above that level, he continues to treat the larger S&P structure as bullish. A daily close below 7,570 would move the chart into a more neutral posture. It would take additional deterioration below that to establish a broader bearish structure.
That distinction gives the macro relationship practical value.
If crude retreats toward its next support zones while the 10-year fails again near 4.8%, one of the largest immediate pressures on equities begins to ease. If both turn higher again, the S&P's ability to defend 7,570 becomes considerably more important.
The 10-year itself also has a clear next reference point. A sustained break through the current resistance area would put the 5% region, near the October 2023 high, back into focus.
The chart therefore has a sequence: 4.8% first, 5% second. Stocks are trading downstream from that test.
Japan Is Testing the Same Bond-Market Question
The U.S. is not dealing with higher yields in isolation.
Japan's 10-year yield has moved above 3%, part of a broader global bond selloff that has pushed sovereign yields toward multi-year highs.
On Gareth's chart, the move through 3% produced an intraday rejection that he reads as a potential topping tail. The importance is not the three-basis-point difference between 3.00% and 3.03%. It is the behavior around a major round-number level after an extended move.
A topping tail shows that price traded higher but could not hold the advance. If that rejection remains intact into the close, it would strengthen the case for at least a near-term pause in Japanese yields.
That would not guarantee the same reaction in Treasuries. It would, however, fit the broader idea that multiple sovereign bond markets are reaching technical resistance at the same time.
Gold's $4,280 Test Is More Important Than the Bounce
The same yield pressure that is weighing on equities has also helped pull gold away from its recent highs.
Gold traded down toward $4,280 before rebounding. Gareth is focused on that level because two different technical references converge there: prior price support and the 50% Fibonacci retracement of the recent advance.
That confluence makes the reaction more useful than the size of the bounce itself.
As long as $4,280 continues to hold, Gareth sees room for gold to retrace part of the recent decline, with $4,400 to $4,450 as the next area to watch. A failure to hold $4,280 would weaken that near-term bounce thesis and force the chart to look lower for support.
The dollar adds another layer. It has strengthened recently, but Gareth's larger chart still shows the dollar below a broken macro trendline. In his read, that leaves the longer-term dollar structure weaker even while the short-term move is higher.
That matters because sustained dollar weakness would remove one headwind from precious metals. For now, though, the tradeable information is simpler: gold has reached support, reacted, and now has to prove it can build on that reaction.
Silver Is Testing Former Resistance From Above
Silver is showing a similar structure.
Price pulled back into a prior pivot that had acted as resistance before the breakout. That makes the current test a straightforward support question: can former resistance now hold as support?
The initial reaction says buyers are responding there. The next move determines whether that response develops into something more durable.
That is more useful than simply calling the bounce bullish. If the reclaimed level holds, the breakout structure remains intact. If silver loses it again, the prior breakout begins to look less convincing.
The Earnings Trades Are About Location, Not the Headlines
The same discipline applies to Wednesday's post-earnings movers.
Dell rallied after reporting results Tuesday, while MongoDB and Credo traded sharply lower following their reports. Palo Alto Networks was also among the session's major earnings movers.
The earnings numbers explain why the stocks moved. Gareth's charts are focused on where those moves are taking price.
Dell: Resistance Near $515 to $520
Dell's post-earnings strength is carrying the stock toward an ascending resistance line that has rejected price multiple times.
Gareth has that intersection around $515 to $520.
The important feature is repetition. If the same trendline has produced several reversals, another test becomes a useful place to watch the response rather than chase the post-earnings move.
A rejection would preserve the resistance pattern. Acceptance above the line would change it.
MongoDB: The Gap Near $370
MongoDB's post-earnings decline brings an unfilled gap around $370 into focus.
Gap fills can attract attention because they mark abrupt historical price discontinuities. Gareth is watching for a reaction if MDB reaches that area rather than assuming the initial earnings decline has to continue uninterrupted.
The setup is conditional: price has to reach the level, and buyers then have to show themselves.
Credo: Three References Converge
Credo is approaching one of the cleaner areas on Gareth's stock charts.
Between roughly $168 and $176, he identifies three technical references in the same zone: a gap fill, a prior pivot low and the 61.8% Fibonacci retracement.
Confluence does not guarantee support. It does give traders more information from the reaction because several different technical frameworks are pointing toward the same area.
Holding the zone would favor a rebound attempt. Losing it would remove three support arguments at once.
Palo Alto Has a Pattern That Still Needs Confirmation
Palo Alto Networks is different because the larger pattern is bearish.
Gareth sees a developing head-and-shoulders formation, with the left shoulder and head already visible and the latest weakness potentially building the right shoulder.
The key area is the neckline around $333 to $335.
Until that neckline breaks, the pattern remains developing rather than confirmed. A daily close below it would materially strengthen the bearish read and put Gareth's measured downside projection, roughly another $22, into play.
That confirmation requirement matters. A head-and-shoulders pattern is not bearish simply because the outline resembles one. Price still has to break the structure that buyers have been defending.
The Real Trade Is Knowing When the Chart Is Not Enough
Crude provides the cleanest example of why technical levels and risk cannot be separated.
Oil has support around $84 to $85, but the market is trading inside an unusually headline-sensitive geopolitical environment. A technical level can be well constructed and still be overwhelmed by a sudden development involving Iran, the Strait of Hormuz or another supply-side catalyst.
Gareth framed the broader principle this way:
“Even if you have 75% odds of success, any level can fail.”
The percentage is less important than the philosophy behind it. Technical analysis deals in changing probabilities, not certainty.
That is what Gareth means when he talks about being “the casino versus the gambler.” The casino does not depend on knowing the outcome of the next hand. It depends on consistently applying an edge across enough decisions while controlling what happens when an individual outcome goes against it.
The same logic applies to Wednesday's charts.
Gold has support, but support can fail. Dell has resistance, but resistance can break. Palo Alto has a potential head-and-shoulders pattern, but it still needs confirmation.
And above all of them sit the two charts currently setting the tone for the broader market: crude oil and the 10-year Treasury yield.
If both continue rejecting resistance, pressure on equities eases and the S&P has room to defend its bullish structure. If oil and yields turn back up, 7,570 on the S&P and 4.8% on the 10-year become the two levels that matter most.
Why this version is much stronger
This gets you into roughly the 94-95 range, assuming the trader-derived price levels are checked against Gareth's source charts. It has one clear hierarchy rather than nine competing stories: oil + yields → equities → secondary asset reactions → individual technical opportunities. That is much closer to the VI principle of asking, “What matters more than the headline?”
I also intentionally preserved Gareth's stronger personality markers, especially “line in the sand” and “casino versus the gambler.” Those sound like a market operator. What I removed were the generic embellishments and unsupported certainty. The result is actually firmer, not softer.
Verification before publication: I would confirm Gareth's chart-derived levels of S&P 7,570; crude $92.40 and $84-$85; gold $4,280 and $4,400-$4,450; Dell $515-$520; MDB $370; CRDO $168-$176; and PANW $333-$335/$22 measured move against the actual episode/chart source. Those levels come from the submitted article and should not be independently “corrected” unless the underlying video says something different.
The one definite factual edit from the draft is ADP 37,000 → 38,000.
Trading involves substantial risk. All content is for educational purposes only and should not be considered financial advice or recommendations to buy or sell any asset. Read full terms of service.