Trading The Close Market Recap - 09/16/2026: Fed's Hawkish Cut Sparks 10-Year Yield Surge — Tech Resilient, Small Caps Weaken

The Federal Reserve raised rates Wednesday, but the more useful signal for traders came from what happened underneath the decision.
The Fed lifted its benchmark rate by 25 basis points to 3.75%-4.00%, and most policymakers projected another increase before year-end. That kept pressure on a Treasury market already testing levels not seen since 2007.
Yet equities did not respond uniformly.
Small caps broke an important long-term trend line. The S&P 500 weakened but found buyers late in the session. The Nasdaq 100 and semiconductors showed better relative strength. Oil, meanwhile, remains an inflation variable the Fed cannot directly control.
That divergence is the story. Rising yields are becoming a more demanding test of which parts of the market can absorb tighter financial conditions and which cannot.
The 10-Year Yield Is the Anchor
For Drew Dosek, the most important technical development was the move in the 10-year Treasury yield.
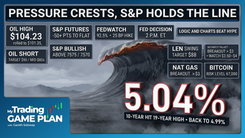
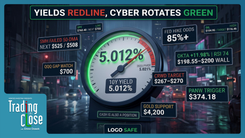
The yield pushed through the 5.021% area and traded as high as roughly 5.04% during the session. That puts the market back around territory last sustained in 2007 and forces traders to consider what happens if the recent breakout holds rather than assuming yields are ready to retreat.
The longer-term chart gives the move additional significance. Drew's next major technical reference sits near 6.249%, corresponding with the 38.2% Fibonacci retracement of the secular decline in yields from the 1981 peak near 15.82%.
That is a projection, not a forecast that yields must get there. The immediate question is much closer: can the 10-year establish itself above the 2023 high, or does this move above 5% fail?
That distinction matters because rising long-term yields transmit through the rest of the market. They affect financing costs, valuation multiples and the relative attractiveness of risk assets. The longer they remain elevated, the more useful the equity divergences become.
Small Caps Are Showing the Pressure First
The Russell 2000 ETF offered the clearest example.
IWM closed beneath an inclining trend line that had been in place since November 2024. That makes the break more important than an intraday violation. Under Drew's framework, the next meaningful downside reference sits near the longer-term parallel support around $273.68.
The significance is not simply that small caps had a bad session.
Smaller companies tend to have greater sensitivity to financing conditions than the cash-rich mega-cap companies dominating the major technology indexes. If yields continue higher while IWM remains beneath its broken trend line, the relative weakness becomes evidence that tighter financial conditions are reaching the parts of the market most exposed to them.
A reclaim of the trend line would weaken that read. Until then, IWM is the clearest technical expression of the pressure coming from higher rates.
Tech Is Not Confirming the Small-Cap Breakdown
That makes the Nasdaq 100 and semiconductors more interesting.
QQQ held up significantly better despite the rise in yields. Buyers stepped in after price tested its lower intraday levels, while SMH also remained comparatively resilient after testing the midpoint of its parallel channel.
That is not what a broad risk-off unwind normally looks like.
It does not mean technology is immune to higher rates. It means the market is still differentiating between groups rather than selling them indiscriminately.
Drew connects part of that relative strength to the balance sheets and investment spending of the largest technology companies, particularly around artificial intelligence infrastructure. The chart is the confirmation mechanism. As long as QQQ and SMH continue holding structure while rate-sensitive groups break down, the market is showing a preference rather than simply telling traders one exists.
If that relative strength disappears and semiconductors begin confirming the weakness already visible in small caps, the broader equity picture changes considerably.
SPY Is Caught Between the Two
The S&P 500 sits between those extremes.
SPY traded lower through much of the afternoon and moved beneath the prior session's lows before producing a sharp intraday tail around the Fed decision. That bounce prevented the session from ending at its weakest point, but it did not erase the technical damage.
Drew is watching whether SPY can reclaim the prior close near 757.39. Failure to do so keeps the next support area around 755 in play.
The important point is not the size of Wednesday's percentage move. It is where the index is sitting relative to the divergence underneath it.
Small caps are breaking structure. Technology is holding up better. SPY is caught in the middle.
That makes the next few closes more informative than Wednesday's headline reaction alone.
Oil Is the Variable the Fed Cannot Directly Control
Rates are only one half of the inflation problem.
Oil remains tied to disruptions in the Middle East, including damage to Saudi Arabia's East-West pipeline. The outage has forced Saudi Arabia to reroute some crude through alternative channels, including shipments via Oman. Those workarounds helped push oil lower Wednesday even though the broader supply risk remains unresolved.
Drew's chart still shows an inclining parallel channel and a larger potential inverse head-and-shoulders structure. If that bullish structure eventually confirms, his technical projections sit around $116.33-$116.40.
The important connection is inflation.
Higher oil does not merely affect the energy chart. Sustained increases can feed into transportation and production costs at the same time the Fed is trying to contain price pressure through higher interest rates.
That is why oil and the 10-year yield should be read together. A cooling oil market would remove some pressure from the inflation side of the equation. Another sustained advance would make the Fed's job more difficult.
Gold and Silver Need Dollar Relief
The same cross-market framework explains what is happening in precious metals.
Gold is threatening the lower boundary of its parallel channel. Drew's key level is around $4,297. A confirmed daily close beneath it would strengthen the breakdown case and put support near $4,202 back in focus.
Silver is carrying similar risk through a developing head-and-shoulders structure. The setup remains conditional. A confirmed break of the relevant neckline area would bring the midpoint of its parallel channel and the prior July consolidation zone into play.
The Dollar Index is the counterweight.
DXY is pressing into a resistance area where Drew sees two technical factors converging. If the dollar rejects there, gold and silver would get some relief from one of the forces currently working against them. If the dollar breaks through instead, the pressure on the metals becomes more difficult to dismiss.
That makes the dollar reaction more useful than treating either metals setup in isolation.
Bitcoin Has a Level, Not a Legislative Verdict
Crypto entered the Fed decision already under pressure after the Senate failed to advance the Digital Asset Market CLARITY Act.
The 49-50 cloture vote fell short of the 60 votes needed to move the legislation forward. That delays the proposed regulatory framework rather than settling the broader regulatory debate.
Bitcoin's chart gives Drew a cleaner way to frame what happens next.
Price is testing the midpoint of a declining parallel channel, with the August 23 daily close around $75,584 serving as his important near-term reference. Holding above it keeps the current support structure intact. A confirmed close below it would strengthen the bearish case and bring the next support around $72,481 into focus.
That is more useful than trying to translate one legislative vote directly into a long-term crypto verdict.
The chart defines where the reaction becomes technically important.
Circle Is a Retest Setup, but the Fundamental Story Is Mixed
CRCL deserves separate treatment.
The stock fell sharply around the CLARITY Act vote, alongside other crypto-linked equities. Circle dropped roughly 9% Tuesday as the legislation failed to advance.
At the same time, earlier versions of the legislation contained provisions that raised questions about stablecoin reward structures, which had previously weighed on Circle and Coinbase. That makes the fundamental implications of the bill's failure less one-directional than the stock's immediate reaction suggests.
Drew's chart is cleaner than that policy debate.
CRCL previously broke above a declining trend line and is now pulling back toward that same area. That creates the breakout-retest structure he frequently watches: former resistance being tested as potential support.
If that retest holds, $89 and then the $100 area become technical levels to watch. A failure back beneath the reclaimed trend line would weaken the setup.
The level decides the trade structure. The legislative narrative does not.
Transportation Is Confirming the Cost Pressure
The weakness in transportation stocks gives the macro argument another layer.
JB Hunt broke beneath a multi-point support shelf, leaving Drew focused on a lower confluence zone near $221.52 where Fibonacci support and an inclining trend line come together. RSI is also approaching deeply oversold territory.
That does not guarantee a bounce. It identifies an area where several technical factors converge and where the character of the selling can be reassessed.
Old Dominion Freight Line is showing similar weakness. ODFL is testing the 61.8% Fibonacci retracement around $174.15 while the 50-day moving average moves toward a possible cross below the 200-day.
If $174.15 fails, Drew's next support references sit near $160 and then around $152.98.
The significance of the two transportation charts is not simply that both stocks are down. They fit the broader transmission mechanism: elevated fuel costs and higher financing pressure showing up in economically sensitive parts of the market.
The Market Is Separating Winners From Weak Links
Wednesday was not a simple Fed-up, stocks-down session.
The Fed raised rates and signaled that additional tightening may still be necessary. The 10-year yield pushed through 5%. Small caps broke long-term structure. Yet technology and semiconductors held up considerably better.
At the same time, oil remains capable of adding inflation pressure from outside monetary policy, while gold, silver and Bitcoin are sitting on technical levels that can tell traders whether the latest weakness is stabilizing or expanding.
That is the framework to carry forward.
Watch the 10-year yield first. Then watch which assets can hold their structure while it remains elevated.
If small-cap weakness spreads into technology and semiconductors, the market's internal picture becomes materially weaker. If yields stall and the stronger groups keep defending support, Wednesday's divergence will have told traders something different: higher rates are applying pressure, but they are not yet breaking everything at once.
That distinction matters more than the Fed headline itself.
Trading involves substantial risk. All content is for educational purposes only and should not be considered financial advice or recommendations to buy or sell any asset. Read full terms of service.