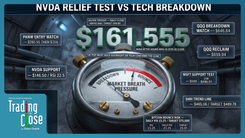
Trading The Close Market Recap - 11/19/2026: Anthropic IPO Sparks Tech Selloff — S&P Breaks Support, Bitcoin & Gold at Risk

Stock Market Breakdown Deepens as S&P 500 and Nasdaq Test Key Support Levels
Trading the Close Market Review | November 19, 2026
The stock market's decline gained momentum Thursday, with important support levels giving way across the major indices and several technology stocks failing to hold early strength. For Verified Investing Pro Trader Drew Dosek, the message from the charts was becoming clearer: sellers have control of the near-term trend, and traders need to prepare for a market where rallies may struggle to hold.
During Thursday's Trading the Close, Drew examined the breakdown in the S&P 500, growing weakness in the Nasdaq 100, and deteriorating technical patterns across semiconductors and individual technology names. He also highlighted deeply oversold conditions in precious metals and Bitcoin, where significant declines are bringing longer-term support levels into focus.
The central challenge is understanding how these conditions fit together. Markets can become extremely oversold and still move lower. They can also produce substantial rallies during an established downtrend. Drew's approach is to identify the levels where those reactions become more likely, then evaluate whether buyers are gaining meaningful control or simply producing another temporary bounce.
Anthropic IPO Reversal Adds to Technology Sector Weakness
One of Thursday's closely watched developments was the reported trading debut of Anthropic, which Drew used to illustrate the difference between an IPO's offering price and the price available to investors once public trading begins.
According to the figures discussed in the recap, Anthropic's offering price was $83, while its opening public-market trade occurred near $111.50. That difference is important because investors evaluating the stock's performance against its offering price may have a very different experience from those who purchased shares after trading opened.
Drew pointed to an initial move higher, followed by a doji candle and a developing bear flag on the intraday chart. The sequence suggested that early buying momentum was fading as sellers began pushing prices lower. A doji reflects indecision, while the subsequent failure to recover can provide stronger evidence that buyers are losing control.
The reversal also came as Nvidia and other technology stocks were struggling to establish sustained buying momentum. Although one stock's decline cannot explain the entire market, the broader failure of technology leadership reinforced the weakness already visible in the major indices.
For traders, the useful signal was the inability of early strength to hold. Until technology stocks begin reclaiming broken levels and sustaining rallies, the sector remains vulnerable to additional selling.
S&P 500 Breaks Support as SPY Targets the Next Technical Levels
The S&P 500 provided one of Thursday's clearest technical warnings. Using the SPY ETF, Drew identified a close near $715.87, below the important $718.99 support level. That breakdown shifts attention toward the next areas where buyers have previously shown interest.
The first level to watch is approximately $711.90, an area associated with earlier consolidation. A reaction there would be reasonable given the previous trading activity, but a bounce alone would not establish that the decline has ended. Traders would need to see whether price can stabilize and begin recovering broken resistance.
Below that area, Drew identified more substantial support near $696. This level sits beneath the psychologically important $700 mark and represents a deeper potential destination if selling continues.
The larger chart also supports a cautious outlook. Drew highlighted a monthly topping tail from October, formed when buyers pushed prices higher but failed to maintain those gains. With price now moving away from that reversal candle, the pattern adds weight to the bearish technical picture.
A more convincing improvement would require SPY to recover important overhead levels, with Drew identifying the $740 region as a major area to reclaim. Until that happens, rallies remain vulnerable to renewed selling.
Nasdaq 100 Technical Breakdown: QQQ Faces a Critical $644.44 Level
The Nasdaq 100 showed a similar deterioration, although its decline has developed somewhat differently from the S&P 500. Drew noted that QQQ closed beneath the important bearish candle from November 5, adding another sign that sellers are maintaining pressure on the index.
The immediate level to watch is Thursday's low near $644.44. A daily close beneath that price would strengthen the bearish setup and bring the next major consolidation support around $625.31 into focus.
That distinction between an intraday move and a confirmed daily close is important. Markets frequently trade through support before recovering, particularly when momentum indicators are already stretched. Waiting for a closing confirmation can help traders distinguish a temporary break from a more established continuation.
The relationship between SPY and QQQ also deserves attention. When both indices begin losing important support, the weakness becomes harder to dismiss as an isolated rotation between sectors. For now, the broader technical picture favors caution until buyers demonstrate that they can defend support and reclaim lost ground.
Semiconductor Stocks Remain Oversold as SMH Fails to Hold Its Breakout
Semiconductors offered another example of the market's difficulty sustaining rallies. The VanEck Semiconductor ETF (SMH) initially moved above a declining trend line, raising the possibility of a short-term breakout. However, the advance faded, and the ETF failed to secure a daily close above that resistance.
Drew also highlighted an extended period of weak momentum, with the relative strength index remaining near the oversold threshold of 30. Such conditions can increase the potential for a sharp technical rebound, especially when sellers begin taking profits or buyers return near established support.
The challenge is separating a rebound from a durable reversal. A rally toward Drew's referenced $510 region would need to be evaluated against the broader trend and the resistance levels that have already rejected price.
Until SMH can reclaim its declining trend line and hold above it, the failed breakout remains the more important signal. Oversold readings provide context for a possible bounce, but price action must confirm whether the sector is actually improving.
Gold and Silver Approach Oversold Conditions and Long-Term Support
While equities were breaking important support levels, Drew also examined the decline in precious metals. Both gold and silver have moved sharply lower, bringing technical support zones and trader psychology into greater focus.
For gold, Drew identified $3,600 as an initial area to monitor, followed by a more established horizontal level near $3,496. The daily RSI was approximately 26.4, indicating deeply oversold momentum. That combination makes the region worth watching for stabilization, although the indicator does not establish where a bottom will form.
Silver presented a similar setup. After a short-lived rebound earlier in the week, the metal resumed its decline toward $43.21. Drew identified $39.47 as an important potential support level, with a broader historical area extending from approximately $40 toward $30.
These levels also supported one of Drew's more useful discussions about trader psychology. Sharp declines often make assets emotionally difficult to approach, even when prices are moving toward areas that previously attracted longer-term interest.
"Who likes paying full price and getting ripped off? I don't. I'd rather buy it when it's discounted," Drew said during the show.
His point was about recognizing how sentiment changes with price. When an asset is advancing rapidly, traders may become increasingly comfortable chasing it. After a substantial decline, the same asset can appear much less attractive, even as its price approaches an established technical support zone.
That does not make every falling market a buying opportunity. Drew's framework still requires identifying meaningful support, understanding the larger trend, and accounting for the possibility of further downside. For longer-term investors considering accumulation, position sizing and a defined risk plan remain essential.
Bitcoin Head-and-Shoulders Pattern Keeps Downside Risk in Focus
Bitcoin's technical structure also remains under pressure. Drew highlighted the loss of a daily bottoming tail that had provided support over several sessions, along with a larger head-and-shoulders pattern that continues to shape the bearish outlook.
The pattern becomes more significant when price breaks its neckline and fails to recover that level on a subsequent rally. According to Drew's chart analysis, Bitcoin's recent inability to reclaim the neckline keeps the measured-move projection in play.
That projection points toward approximately $37,500, near a historical reference level around $38,546. These are longer-range technical objectives derived from the chart pattern, rather than predictions that Bitcoin must reach those prices.
The immediate picture is more complicated. Drew noted that Bitcoin's daily RSI was near 19, an extremely oversold reading that increases the possibility of a sharp countertrend move. He identified the $60,000 region as an area where buyers could attempt to stabilize price.
If support develops there, Bitcoin could rebound toward the underside of its previously broken parallel channel. Such a move would still need to overcome overhead resistance before the larger bearish structure could be considered meaningfully improved.
This is a recurring feature of declining markets. The deeper an asset becomes oversold, the more forceful its temporary recoveries can be. Those rallies can offer trading opportunities, but they can also create false confidence if the underlying trend remains intact.
Meta, Google and Williams-Sonoma Show Continued Stock-Specific Weakness
Beyond the indices, several individual stocks illustrated how bearish chart structures are developing across different parts of the market.
Williams-Sonoma (WSM) fell sharply following its earnings release, with the draft recap reporting a decline of approximately 15%. Drew highlighted a previous weekly topping tail as an early technical warning that buyers were struggling to maintain higher prices. The earnings reaction accelerated the decline, bringing the $214.47 area into focus. Below that, the psychological $200 level becomes an important potential support zone.
Meta also remains under pressure following its late-October decline. Drew identified a developing bear flag, with after-hours weakness adding to the possibility of another move lower. A confirmed daily close beneath the recent low pivot would strengthen the bearish case and bring the lower boundary of its parallel channel, near $530.16, into focus.
Google's chart offered another example of support becoming increasingly important. Drew identified a confluence area around the 50% Fibonacci retracement at $274.54 and a previous low-range pivot near $272.11. If that zone fails on a closing basis, the next downside levels are approximately $255 and the 61.8% Fibonacci retracement near $242.91.
With Google's RSI already near 30, a deeper decline could create increasingly oversold conditions. However, the presence of Fibonacci support and an extreme momentum reading would still need to be accompanied by evidence of buyers returning.
Across these setups, the common thread is straightforward: bearish patterns are developing, and several stocks are approaching areas where the next reaction could become important. Drew's emphasis remains on letting price reach those levels rather than assuming a reversal is imminent.
Treasury Yields and Energy Markets Add Context to the Selloff
The bond market provided an interesting divergence during Thursday's session. The 10-year Treasury yield moved lower even as stocks continued to decline, suggesting that easing yields alone were insufficient to restore buying interest in equities.
Drew identified support around 5.01% on the 10-year yield, with 5.157% serving as a potential upside reference if yields recover. A rebound in yields could introduce additional pressure on interest-rate-sensitive stocks, although the direction of the bond market will need to be evaluated alongside the broader economic outlook.
Energy markets were comparatively mixed. Oil showed relative resilience, with the draft reporting a gain of approximately 0.62%, while remaining beneath a declining trend line. Drew identified support near $82.21 as an area to monitor.
Natural gas pulled back approximately 3% following its recent advance. Support around $3.43 represents the nearer-term level, while an ascending trend line near $3.20 provides a deeper potential area of interest.
These markets remain secondary to the equity breakdown, but they help illustrate the uneven behavior developing across asset classes. Traders should avoid assuming that every market will respond to the same catalyst or follow the same technical path.
What Traders Should Watch Next as Market Volatility Increases
Thursday's session reinforced a change in the market's character. Important support levels are breaking, technology leadership is struggling, and several major assets are approaching deeply oversold conditions.
Drew emphasized that traders need to adjust their expectations when market conditions change.
"If we do have this flipping to a bear market where we're selling hard, there still will be robust bounces, but the sales will be extreme too," he cautioned.
That observation is particularly relevant when momentum becomes stretched. A sharp rally after an extended decline can look convincing, especially when it follows several consecutive down sessions. But the strength of a bounce needs to be judged against the resistance levels above it and the broader structure that preceded it.
For the next session, SPY's reaction around $711.90 and QQQ's ability to hold $644.44 are among the most important equity signals. A confirmed QQQ breakdown would bring $625.31 into focus, while further weakness in SPY would increase attention on the deeper $696 support area.
Semiconductors also need to demonstrate that buyers can sustain strength rather than allowing another rally to fail at resistance. Meanwhile, Bitcoin's reaction near $60,000 and the behavior of gold and silver around their respective support zones will help determine whether deeply oversold assets are beginning to stabilize.
Bottom Line: Respect the Downtrend and Let Support Confirm the Trade
The message from Thursday's Trading the Close was that market structure continues to deteriorate, even as several assets approach levels where technical rebounds could develop.
Drew's analysis points to a market where traders need to be selective. Broken support, failed rallies, and bearish continuation patterns favor a cautious near-term outlook. At the same time, extreme oversold conditions mean that countertrend rallies could be sharp enough to challenge traders who become overly committed to one direction.
The next test is whether buyers can defend the support levels now coming into view and begin reclaiming resistance. Until the charts provide that evidence, the prevailing downtrend deserves respect.
The opportunity is in having a plan before price reaches the level, knowing what would confirm the setup, and recognizing when the market is telling you that the original thesis needs to change.
Trading involves substantial risk. All content is for educational purposes only and should not be considered financial advice or recommendations to buy or sell any asset. Read full terms of service.