Bullish Signs For Silver: Upside To $38.50 Likely
Article Summary: Silver is starting to send technical signals of being bullish. The recent price action and long-term chart analysis is raising probabilities of a bullish surge to an upside target of $38.50.
--------------------------------------------------------------------------------------------
The silver market has given technical traders plenty to analyze over the past several years, and today's chart paints a particularly compelling picture. We're looking at a weekly timeframe of silver (USD/OZ), which shows a fascinating multi-year technical setup that appears to be setting the stage for a significant move higher. After respecting a long-term resistance trendline for over eight years and successfully converting a stubborn resistance level into fresh support, silver now stands at a pivotal juncture. Let's dive into what the chart is telling us and explore the potential scenarios that could unfold in the coming months.
The Big Picture: A Multi-Year Trendline Defining the Battleground
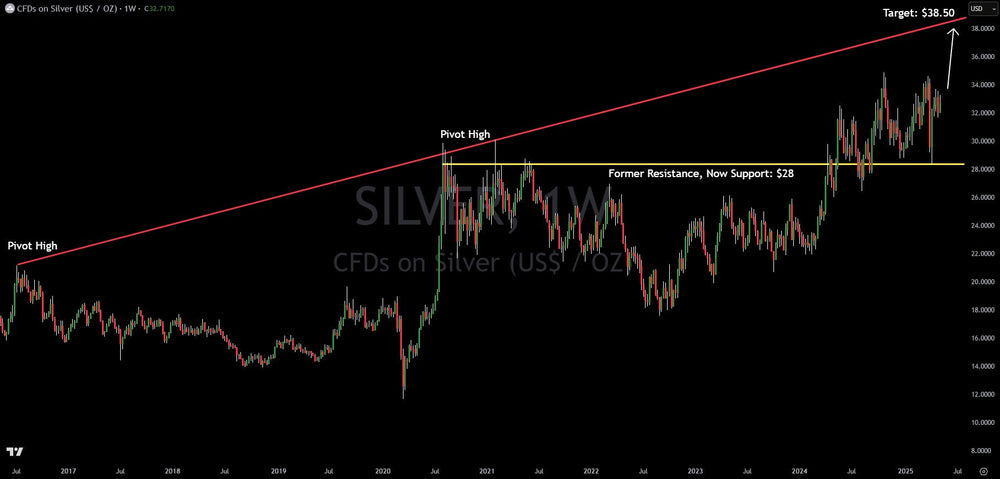
The most striking feature on this silver chart is the prominent red ascending trendline that extends from 2017 to our current price action. This isn't just any trendline – it's a multi-year resistance boundary that has capped silver's advances with remarkable precision. Notice how price has made contact with this barrier at two key pivot highs – first in early 2017, and again during the 2020-2021 period. These touchpoints weren't random; they represent significant psychological battlegrounds where sellers overwhelmed buyers.
What makes this trendline particularly significant is its longevity and the clean reactions we've seen at each contact point. When a technical barrier holds firm across multiple market cycles and years of trading, it takes on greater importance. Market participants – both retail and institutional – tend to recognize these barriers, creating a self-fulfilling prophecy that reinforces their significance.
Key Price Level Transformation: The $28 Battle Zone
Shifting our focus to the yellow horizontal line at $28, we're seeing one of the most powerful phenomena in technical analysis play out before our eyes – the conversion of a former resistance level into new support. This $28 level once acted as a ceiling, repeatedly rejecting silver's advances. However, as the old market adage goes, "what was once resistance becomes support when broken" – and that's exactly what we're witnessing.
The psychology behind this transformation is fascinating. Traders who were previously selling at this level, believing silver was overvalued, are now often the same ones buying when price returns to this area, fearing they'll "miss the boat" if they don't enter. Additionally, those who sold at this level and watched price break higher often place buy orders to cover their positions if price returns to their entry, creating natural support.
What's particularly encouraging for silver bulls is how price has respected this newly established support zone in recent corrections. Notice how the market has made several tests of this $28 region, yet buyers have consistently stepped in, preventing sustained breaks below this threshold. This behavior suggests genuine strength in the underlying trend.
Current Price Action: Coiling for the Next Leg Higher?
The recent price action in silver shows a healthy consolidation pattern in the $30-34 range, with a series of higher lows and higher highs – the textbook definition of an uptrend. This consolidation appears to be laying the groundwork for the next significant advance.
What strikes me about the current price structure is how methodically silver has been building its base. Rather than experiencing a parabolic move that often leads to equally dramatic reversals, silver has been climbing in measured steps, establishing new support levels along the way. This type of advance tends to be more sustainable and often leads to longer-lasting bull markets.
The white arrow pointing toward the $38.50 target isn't arbitrary – it represents the logical extension of the current trend, aligned with the upper resistance boundary that's been guiding this market for years. Markets often move in rhythmic patterns, and the projection to $38.50 respects both the angle of ascent and the historical volatility profile of silver.
Volume Analysis and Market Participation
While the chart doesn't display volume indicators, it's worth noting that healthy advances in precious metals typically coincide with expanding volume during up moves and contracting volume during pullbacks. For traders looking to confirm the strength of this pattern, monitoring volume during the next attempted move toward $38.50 would be prudent.
In silver specifically, we often see volume spikes during key breakouts as institutional money flows into the market. The convergence of technical triggers – like clearing a multi-year trendline – can serve as powerful catalysts for larger players to increase their positions.
Potential Scenarios and Trade Setups
Looking ahead, several scenarios could unfold from here. The most bullish case, and the one suggested by the chart markup, shows silver continuing its advance toward the $38.50 target. This move would represent a clean breakout above the long-term resistance trendline and continuation of the broader uptrend.
For traders considering entries, the recent consolidation in the $30-34 range offers interesting opportunities. Conservative traders might wait for a decisive breakout above $34.50 with increasing volume, using the breakout level as their stop-loss reference point. This approach sacrifices some potential upside for increased confirmation.
More aggressive traders might consider entering during pullbacks toward the $28 support level, which offers a more favorable risk-reward ratio but comes with the inherent risk of deeper corrections. In either scenario, the $38.50 target provides a clear profit objective.
What makes this setup particularly attractive is the clear invalidation level. If silver were to decisively break and close below the $28 support zone on a weekly basis, it would signal that the bullish narrative needs reevaluation. Having such well-defined risk parameters is valuable in managing position sizes and overall portfolio exposure.
Risk Considerations and Potential Headwinds
No technical analysis would be complete without acknowledging potential headwinds. Silver, while primarily driven by technical factors and inflation hedging, also carries exposure to industrial demand. Any significant global economic slowdown could impact this component of silver's demand equation.
Furthermore, precious metals often move inversely to real interest rates. Should we see a sharp rise in real yields without corresponding inflation fears, this could create temporary pressure on silver prices.
However, the technical structure remains compelling regardless of these considerations. The market has spoken through price action, and the pattern of higher lows and successful tests of the $28 support level suggests underlying strength that could overcome these potential headwinds.
Conclusion: The Path to $38.50
Taking a step back to view silver's technical picture holistically, we're seeing what appears to be the middle stages of a long-term bullish trend. The conversion of the $28 level from resistance to support, combined with price action respecting the upward trajectory, paints a compelling picture for silver bulls.
The $38.50 target represents the next significant milestone in this journey. Getting there won't happen in a straight line – markets rarely move that way – but the technical foundation appears solid. For traders and investors alike, this silver chart offers one of the cleaner technical setups in the commodities space, with well-defined support, a clear target, and identifiable risk parameters.
As always, proper position sizing and risk management remain paramount, regardless of how compelling the technical picture appears. The chart may be pointing to $38.50, but the path there will likely contain enough volatility to shake out overleveraged positions.
What will you be watching for in silver's next move? For me, it's how convincingly price handles the $34-35 range – clearing that with authority would significantly increase the probability of reaching our $38.50 target sooner rather than later.
Written by Chief Market Strategist Gareth Soloway from VerifiedInvesting.com
This article is intended for informational and educational purposes only and does not constitute financial advice. All trading involves risk. Past performance is not indicative of future results. Trading involves substantial risk. All content is for educational purposes only and should not be considered financial advice or recommendations to buy or sell any asset.
Trading involves substantial risk. All content is for educational purposes only and should not be considered financial advice or recommendations to buy or sell any asset. Read full terms of service.