Chart Analysis: Parallel Channel On Gold Gives Upside And Downside
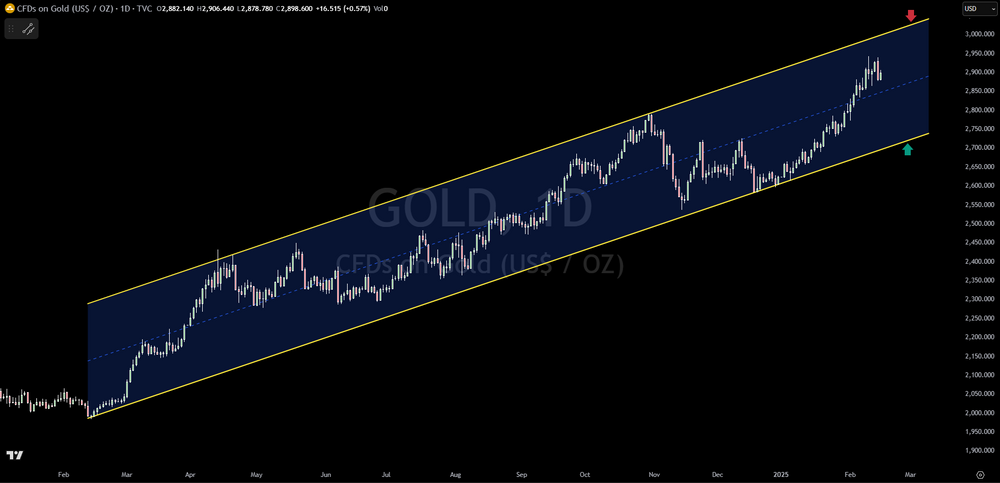
Gold's impressive rally continues, with prices soaring over 40% since the start of 2024. This remarkable performance has unfolded within a well-defined upsloping parallel channel, a classic technical pattern that provides valuable insights into potential future price movements. For technical analysts, this channel offers clear levels of resistance and support, creating trading opportunities.
The upper trendline of this channel, currently hovering around $3,000 per ounce, acts as a significant resistance level. This line represents the upper boundary of gold's recent price trajectory, and a sustained break above this level could signal further upside potential. A decisive move above $3,000 would suggest strong bullish momentum and could open the door to even higher price targets. Traders will be watching closely for a breakout, confirmed by strong volume, as a signal of renewed upward momentum.
Conversely, the lower trendline of the parallel channel, presently around $2,750 per ounce, provides crucial support. This line represents the lower boundary of gold's upward trend, and a break below this level could indicate a potential shift in market sentiment. A sustained move below $2,750 would suggest weakening bullish momentum and could lead to a period of consolidation or even a correction. Traders should be prepared for increased volatility around this support level.
Until gold convincingly breaks above the $3,000 resistance or below the $2,750 support, the parallel channel remains the dominant force. These levels define the boundaries of the current trend and offer potential entry and exit points for traders. Within this channel, traders can employ various strategies, such as buying near the support line and selling near the resistance line. However, it's crucial to remember that no technical pattern is foolproof, and traders should always manage risk appropriately. A confirmed break of either trendline would signal a significant change in the prevailing trend and require a reassessment of trading strategies.
Note the chart above.
This article is intended for informational and educational purposes only and does not constitute financial advice. All trading involves risk. Past performance is not indicative of future results. Trading involves substantial risk. All content is for educational purposes only and should not be considered financial advice or recommendations to buy or sell any asset.
Trading involves substantial risk. All content is for educational purposes only and should not be considered financial advice or recommendations to buy or sell any asset. Read full terms of service.