Natural Gas Shows Textbook Head and Shoulders Development
The art of successful trading often comes down to one simple principle: seeing the setup before everyone else does. Right now, Natural Gas is offering us exactly that opportunity with what could develop into one of the cleanest head and shoulders patterns I've tracked in months.
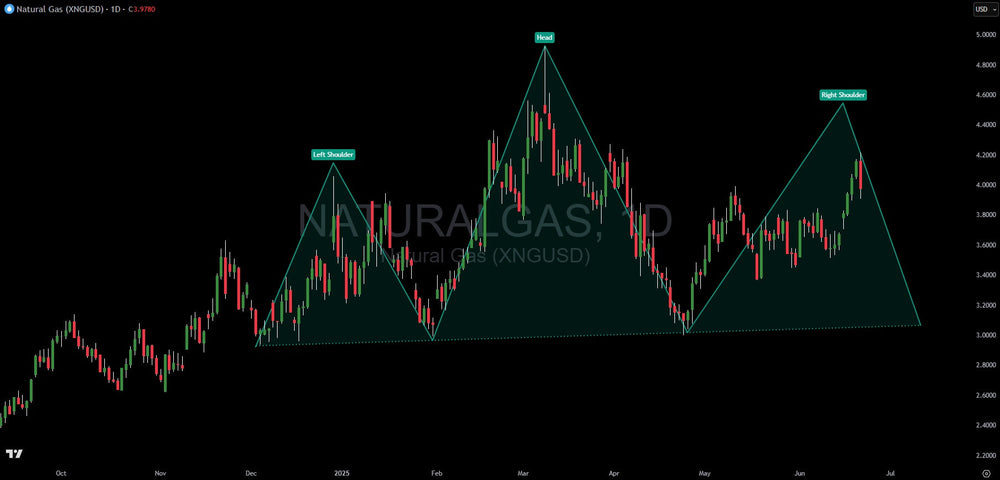
As I write this, Natural Gas futures are trading around $3.98, and while most traders are focused on daily price swings, the bigger picture is revealing something far more significant. We're watching a potential bearish reversal pattern unfold in real time – one that hasn't completed yet, but deserves serious attention from anyone trading energy commodities.
The Pattern Taking Shape
Let me walk you through what's developing on the Natural Gas daily chart. We've got a textbook head and shoulders formation that began taking shape back in late 2024, and it's been methodically building ever since.
The left shoulder formed first, peaking around $4.20 in early 2024. Nothing too dramatic there – just another high in what had been a volatile energy market. But then came the head, which reached approximately $5.00 in early 2025. That spike higher caught attention, but what happened next is where things got interesting for pattern traders.
Instead of continuing higher, Natural Gas began working lower, setting up what would become our current right shoulder. This peak has formed around the $4.60 level – notably lower than the head, which is exactly what we want to see in a proper head and shoulders development.
Now here's the key point that many traders miss: this pattern hasn't completed yet. The right shoulder is still in the process of forming, and that means we're in that sweet spot where informed traders can position themselves ahead of potential confirmation.
Why This Setup Matters
The power of the head and shoulders pattern lies in its psychological underpinnings. What we're essentially seeing is a battle between buyers and sellers, with each successive peak showing weaker buying pressure. The left shoulder represents initial strength, the head shows one final push higher, and the right shoulder reveals exhaustion in the upside momentum.
In Natural Gas specifically, this pattern development makes sense when you consider the seasonal dynamics and current market structure. We've seen periods of strength followed by profit-taking, and now the market seems to be struggling to recapture those previous highs.
The neckline – that horizontal support level connecting the lows between our shoulders and head – sits around the $3.00 to $3.10 area. This becomes our line in the sand. As long as this level holds, the pattern remains in development. But if Natural Gas breaks below this neckline with conviction, that's when the pattern triggers and things could get interesting quickly.
What I'm Watching For
Pattern recognition is about patience as much as it is about technical skill. Right now, I'm monitoring several key elements that will determine whether this setup plays out or fails.
First, the neckline integrity around $3.00-$3.10 remains absolutely critical. Any decisive break below this level with decent volume would activate the pattern and suggest further downside pressure. The measured move from a completed head and shoulders typically equals the distance from the head to the neckline, projected downward from the break point.
Second, I'm keeping a close eye on the right shoulder's development. Remember, patterns need proper proportions to be valid. If Natural Gas suddenly rockets above that $5.00 head level, the entire setup becomes invalid. That's our abort signal – the level where this particular pattern thesis gets thrown out the window.
Volume will be another telling factor. True pattern breaks typically come with expanding volume, showing that institutional players are getting involved. If we see a neckline break on light volume, I'd be more skeptical about follow-through.
The Risk Management Reality
Let's talk about what could go wrong, because that's how successful traders think. The most obvious risk is pattern failure. If the right shoulder pushes above the head at $5.00, this entire analysis becomes worthless. Markets don't always cooperate with our pattern recognition, and Natural Gas could easily decide to resume its upward trajectory.
There's also the possibility of a false break below the neckline. We might see price dip below $3.00, trigger stops, and then reverse higher – leaving pattern traders holding the bag. This is why confirmation and proper position sizing matter so much in pattern trading.
Additionally, external factors could override technical patterns entirely. Energy markets are particularly susceptible to weather events, geopolitical developments, and supply disruptions. A cold snap or unexpected pipeline issue could send Natural Gas higher regardless of what the chart patterns suggest.
Current Market Psychology
What strikes me about this developing pattern is how it reflects broader energy market sentiment. We've seen Natural Gas experience significant volatility over the past year, with periods of strength followed by sharp reversals. This head and shoulders development could be the market's way of resolving this uncertainty.
The psychology behind the pattern makes sense: initial strength (left shoulder), one more push higher that fails to sustain (head), and now a final attempt to rally that's showing signs of weakness (right shoulder). Each successive peak demonstrates diminishing bullish conviction.
For traders who understand market psychology, this setup represents a potential shift from accumulation to distribution – from smart money buying dips to smart money selling rallies.
The Waiting Game
Right now, we're in that challenging phase where patience becomes paramount. The pattern hasn't completed, which means we can't take action yet. But we can prepare.
If you're considering a bearish position on Natural Gas, the neckline break around $3.00 would be your entry signal. Until then, it's about watching and waiting. Pattern trading requires discipline – the ability to see the setup developing without jumping in too early.
The beauty of spotting patterns before they complete is that it gives you time to plan your trade execution. You can determine your entry point, calculate your stop loss level, and identify potential profit targets all before the market moves.
Looking Ahead
Natural Gas is offering us a masterclass in pattern recognition right now. We've got a well-defined head and shoulders formation in development, clear invalidation levels, and a precise trigger point for entry.
The key is remembering that patterns are probabilities, not certainties. This setup increases the odds of bearish price action if it completes, but markets always have the final say. That's why we trade with stops, manage our risk, and never bet more than we can afford to lose.
For now, Natural Gas remains in that critical phase where the right shoulder continues to develop. Watch the $5.00 level above for pattern invalidation, and the $3.00-$3.10 neckline below for potential activation. Sometimes the best trades are the ones you see coming from miles away – and right now, Natural Gas might be setting up exactly that kind of opportunity.
This article is intended for informational and educational purposes only and does not constitute financial advice. All trading involves risk. Past performance is not indicative of future results. Trading involves substantial risk. All content is for educational purposes only and should not be considered financial advice or recommendations to buy or sell any asset.
Trading involves substantial risk. All content is for educational purposes only and should not be considered financial advice or recommendations to buy or sell any asset. Read full terms of service.