Technical Chart Analysis: Copper Has Likely Topped
Copper has experienced a significant rally in the first quarter of 2025, demonstrating substantial strength. Starting the year at $4.02 on January 2nd, the price of copper surged to a high of $5.40 by March 26th, 2025, marking an impressive gain of approximately 34%. While this sharp increase might initially suggest robust demand driven by economic growth, the primary catalyst appears to be the implementation and anticipation of tariffs. Historically, price surges in copper not underpinned by fundamental economic expansion tend to be less durable.
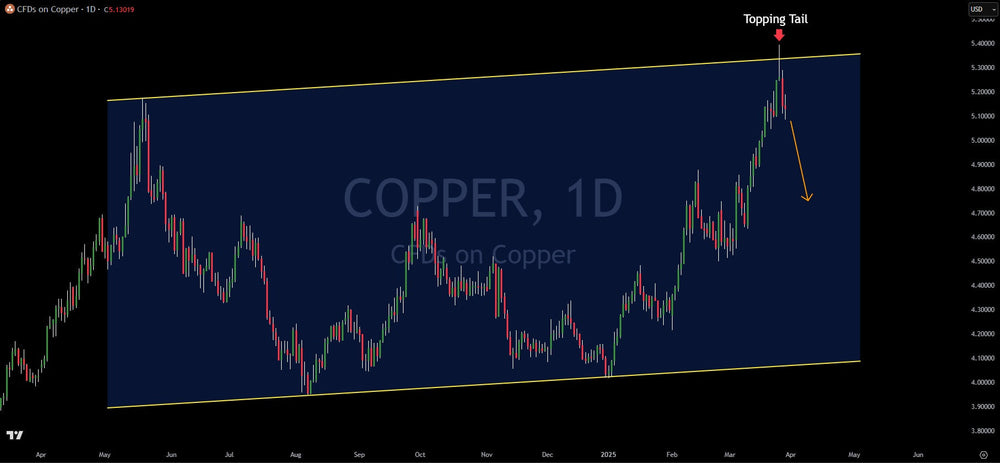
Interestingly, on March 26th, after reaching the $5.40 peak, copper's price action took a bearish turn. The metal reversed sharply and closed near the day's lows, forming a technical pattern known as a "topping tail" or "shooting star." This candlestick pattern, characterized by a long upper wick and a small real body near the low of the day, is often interpreted by technical analysts as a signal of potential bearish reversal, indicating that buyers were unable to sustain the upward momentum.
This topping tail formation occurred precisely at the upper boundary of a well-defined parallel channel. This channel can be constructed by connecting the series of lows observed from August 2024 through January 2025 to establish the lower trendline. By then drawing a parallel trendline upwards from a key high in May 2024, this upper trendline neatly coincides with the recent all-time high of $5.40 reached on March 26th. The fact that the price hit the upper resistance of this established channel and simultaneously formed a bearish topping tail pattern significantly increases the probability of a major top having been established in copper and suggests an impending substantial correction.
This scenario mirrors the dynamics observed in other markets, such as the Hang Seng Index, which experienced a significant surge in 2024 followed by a pullback to a key buy zone. This highlights a common principle in technical analysis: after a strong upward move, assets often experience a period of consolidation or correction. In the case of copper, the confluence of the parallel channel resistance and the bearish topping tail suggests that a move lower is likely. A retracement to at least the $4.73 level appears probable in the coming weeks and months as the market digests the recent surge and reacts to the bearish technical signals.
Verified Investing provides investors with purely data-driven analysis, moving beyond mainstream media and social media noise. By focusing on objective charts and data, we deliver probability-based trading insights to empower both ourselves and our members, aiming to be a strategic "house" rather than speculative "gamblers."
This article is intended for informational and educational purposes only and does not constitute financial advice. All trading involves risk. Past performance is not indicative of future results. Trading involves substantial risk. All content is for educational purposes only and should not be considered financial advice or recommendations to buy or sell any asset.
Trading involves substantial risk. All content is for educational purposes only and should not be considered financial advice or recommendations to buy or sell any asset. Read full terms of service.