WTI Crude Oil: The $65-67 Break Signals More Pain Ahead as OPEC+ Wages Economic War on US Shale
The crude oil market is telling us a story that every investor needs to understand, and frankly, it's not a pretty one for the US economy. After analyzing the weekly chart of WTI crude oil, what I'm seeing is a technical breakdown that's been years in the making, now accelerated by a calculated assault from OPEC+ that's designed to put American shale producers out of business.
Let me walk you through what this chart is really telling us, because the implications go far beyond just oil prices – they're signaling some serious headwinds for the broader economy.
The Technical Picture: A Critical Support Zone Under Siege
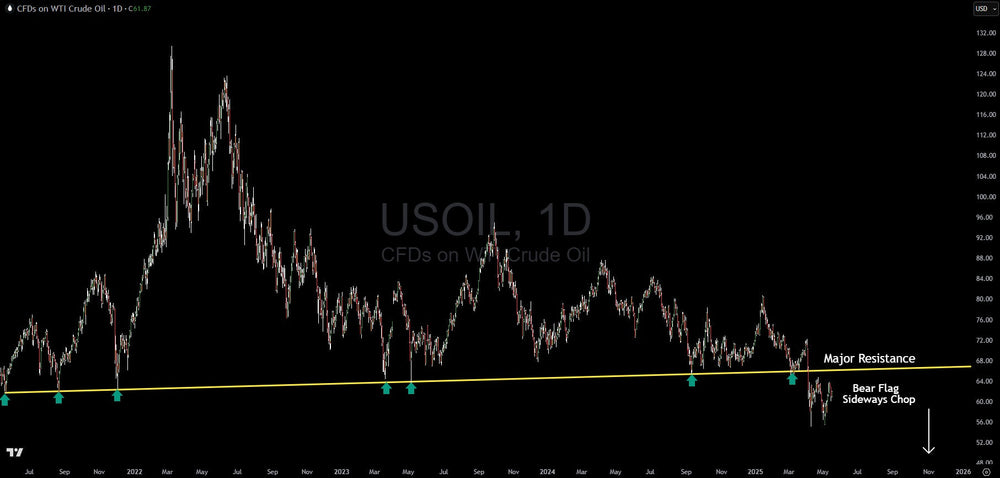
Looking at this weekly chart, there's one level that jumps out immediately: that $65-67 zone that's been acting as both major resistance and major support over the past several years. This isn't just any old support level – it's what I call a "decision zone" where the market has repeatedly made pivotal moves.
Here's what makes this level so significant: Notice how price tested this zone multiple times throughout 2019 and early 2020 before the pandemic crash. Then, during the recovery rally that took us all the way up to $120+ in 2022, this same $65-67 area provided crucial support on the way up. It's been tested, retested, and proven itself as a critical battleground between buyers and sellers.
But now we're seeing something different. Price has broken below this key support zone and is currently trading around $60.68, with that red arrow on the chart pointing to further downside. When a support level that's held for years finally gives way, it typically signals that the underlying dynamics have fundamentally shifted.
The technical message here is clear: the bulls have lost control, and we're likely heading lower.
The Fundamental Driver: OPEC+'s Calculated Strategy
Now, here's where the story gets really interesting – and concerning. What we're witnessing isn't just a normal commodity cycle. This is economic warfare, plain and simple.
OPEC+ have been systematically ramping up production with one clear objective: to crush US shale producers. In May 2025, they tripled their expected production increase to 411,000 barrels per day, and they're planning to unwind a massive 2.2 million barrels per day in voluntary cuts over the next 18 months. That's not market management – that's a strategic assault.
The math here is brutal for American producers. Saudi Arabia can pump oil profitably at just $3-5 per barrel. Russia can make money at $10-20 per barrel. Meanwhile, US shale producers need oil prices above $65 per barrel just to break even. Some of the better Permian locations might be profitable at $45-50, but the average US shale operation requires $65 or higher to justify continued drilling.
With oil now trading around $60 and OPEC+ flooding the market with additional supply, you can see the squeeze play developing. Saudi officials have even briefed industry experts that they can handle oil at $60 per barrel for an extended period, even if it means borrowing to balance their budget. They're essentially saying: "We can outlast you."
The Economic Warning Signal
But here's what really concerns me as we analyze this chart: declining oil demand is one of the most reliable early warning signals of economic trouble ahead. And that's exactly what we're seeing.
Global oil demand growth has been revised down sharply – from over 1 million barrels per day to just 730,000 barrels per day for 2025. The International Energy Agency is projecting even slower growth ahead. When oil demand growth slows this dramatically, it's telling us that economic activity is cooling faster than expected.
Trade tensions and tariff concerns are already showing up in the data. Consumer confidence has plunged to nearly five-year lows, and the Conference Board's Leading Economic Index registered its largest monthly decline since March 2023 – when many feared the US was headed into recession.
Oil prices have historically been one of the best recession predictors, and what this chart is showing us should make every investor pay attention. When a commodity that's essential to virtually every aspect of economic activity starts breaking critical support levels, it's usually not because things are going well.
What This Means for US Shale Producers
The implications for American oil companies are stark. We're already seeing producers slash capital expenditures and reduce rig counts. Diamondback Energy, one of the largest shale independents, told investors that "it is likely that U.S. onshore oil production has peaked and will begin to decline this quarter."
This runs completely counter to President Trump's "drill baby drill" agenda. The reality is that you can't drill profitably when oil is trading below your breakeven costs. The industry needs sustained prices above $65 per barrel to justify continued investment, and OPEC+ is systematically ensuring that doesn't happen.
Companies are already releasing drilling crews and cutting 2025 spending budgets. If oil stays in the $50-60 range for an extended period, we could see a wave of bankruptcies similar to what happened during the 2014-2016 oil price war.
Technical Scenarios: Where We're Headed Next
From a technical perspective, that breakdown below $65-67 support opens the door to significantly lower prices. The red arrow on the chart suggests we could be looking at a move toward the $40-50 range, which would be devastating for US shale producers.
There are a few potential scenarios playing out:
Bearish Scenario (Most Likely): Oil continues to weaken as OPEC+ follows through on production increases and economic growth slows. A sustained break below $60 could target the $50-55 area, potentially triggering a wave of US production cuts and company failures.
Base Case: Oil finds some support in the $55-60 range as the market balances OPEC+ increases against declining US production. However, this still represents a challenging environment for American producers.
Bullish Scenario (Less Likely): Geopolitical tensions or a faster-than-expected economic recovery could drive prices back above $65. However OPEC+ would likely respond by accelerating production increases, capping any rally.
The Invalidation Point
For the bulls to regain control, we'd need to see a decisive move back above that $67 level with strong volume confirmation. Until that happens, the path of least resistance remains to the downside.
Any rally that fails to reclaim $65-67 should be viewed as a selling opportunity rather than the start of a new uptrend.
Investment Implications: Positioning for the New Reality
The message from this chart is clear: we're entering a lower oil price environment, and that has broad implications for investors. Energy stocks are likely to remain under pressure, particularly smaller shale producers with higher breakeven costs.
For the broader market, sustained weakness in oil could signal economic trouble ahead. Historically, major breaks in commodity prices have preceded broader economic slowdowns. The fact that this is happening alongside deteriorating consumer confidence and leading economic indicators should make investors increasingly cautious about risk assets.
On the positive side, lower oil prices could provide some relief on inflation pressures, potentially giving the Federal Reserve more flexibility on interest rates. However, the economic damage from a major contraction in US energy production could offset those benefits.
The Bottom Line
What we're seeing in crude oil right now isn't just a commodity story – it's a warning signal about the broader economy and a reminder of how geopolitical dynamics can override domestic policy objectives.
The technical breakdown below $65-67 support suggests we're heading into a period of sustained weakness that could test the resilience of US shale producers and signal broader economic challenges ahead. OPEC+'s strategic decision to flood the market with additional supply, despite weakening demand, shows they're willing to sacrifice short-term revenues to regain long-term market share.
For investors, the message is clear: stay defensive, watch for signs of further economic deterioration, and be prepared for a period where energy independence comes at a much higher cost than many anticipated. The oil market is often the canary in the coal mine for broader economic trends, and right now, that canary is sending some very concerning signals.
Keep your eyes on that $60 level as the next critical support. If that gives way, we could be looking at a much more severe downturn than many are currently expecting.
This article is intended for informational and educational purposes only and does not constitute financial advice. All trading involves risk. Past performance is not indicative of future results. Trading involves substantial risk. All content is for educational purposes only and should not be considered financial advice or recommendations to buy or sell any asset.
Trading involves substantial risk. All content is for educational purposes only and should not be considered financial advice or recommendations to buy or sell any asset. Read full terms of service.