Bitcoin: Deep Dive Into The Technical Chart And Probabilities

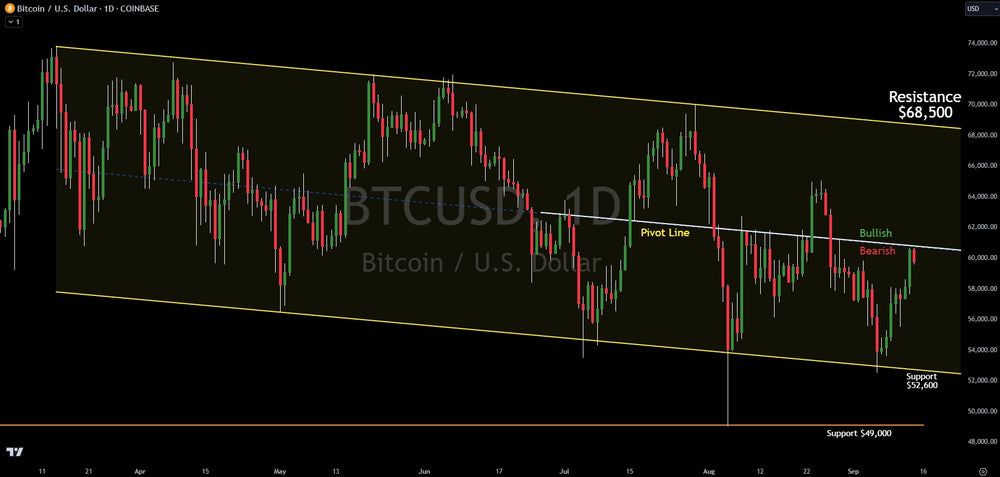
After tagging key trend line support at $52,800, Bitcoin staged a solid bounce in the last week. True to technical analysis and the levels given last week, the upside resistance was the pivot line at $61,000. Bitcoin kissed it and has been pushed back slightly...for now.
Probability still favors the downside as long as price does not confirm above the pivot line. Should price confirm above the pivot line on Bitcoin, a change in technical probabilities would take place, pushing the odds sharply higher that Bitcoin would surge to $68,500.
Should Bitcoin fall again, downside support is now at $52,600. It is lower than last week's $52,800, because the trend line is down-sloping, thus lower each week.
Should Bitcoin flush below $52,600, $49,000 remains major support.
Bitcoin continues to struggle relative to the stock market. With the Federal Reserve decision to likely cut rates by 25 bps next week, the big question will be, does it help the stock market head back to all-time highs and will that ignite a breakout above the pivot line on Bitcoin? All eyes are on the decision on Wednesday, September 18th at 2pm ET.
Verified Investing fights for the small investor by giving institutional analysis. While most investors focus on mainstream media narratives and social media hype, Verified Investing gives probability based data and technical analysis. Become the casino, not the gambler.
Trading involves substantial risk. All content is for educational purposes only and should not be considered financial advice or recommendations to buy or sell any asset. Read full terms of service.


