Bitcoin: Insight The Charts, Data And Key Levels
As technical analysis suggested, Bitcoin was likely headed lower this past week. In last week's update we noted that Bitcoin was back below the bullish/bearish pivot line. This meant probability favored the downside. The charts and analysis did not disappoint.
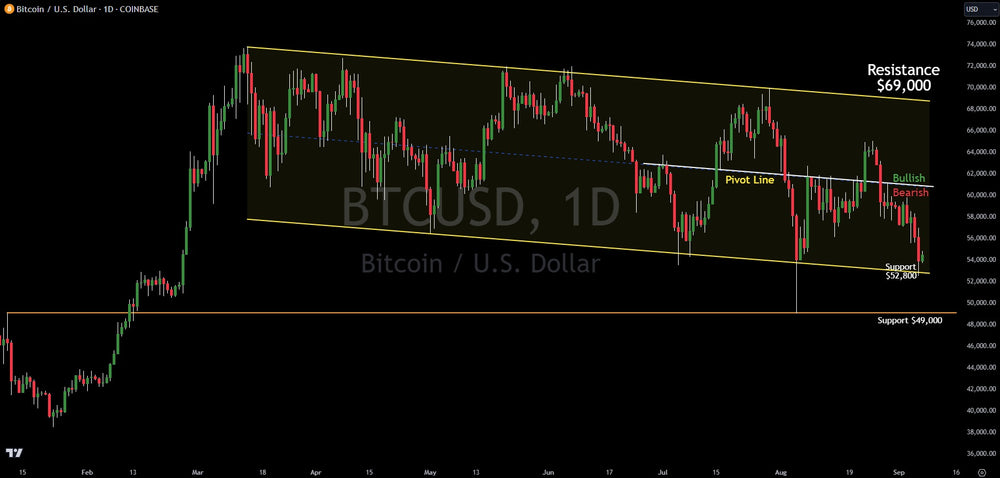
Bitcoin fell sharply on the week, dropping from near $60,000 to a low of $52,800. In last week's update, it was clearly posted that the $52,800 level was the key support. Sure enough, it hit this level and bounced.
While bulls will hope that the downside is complete and the next bull run can start, technical analysis says, 'not so fast'. The stock market and risk-asset selling has become a major issue for Bitcoin and all of cryptocurrency. The stock market had one of its biggest down-weeks in years and it hurt the crypto sector. If that continues, Bitcoin could break the key $52,800 level and fall to the next support at $49,000.
For the bulls to regain the advantage, Bitcoin must close and confirm back above the pivot line at $61,000. If that happens, resistance will be $69,000 and $74,000.
Overall, Bitcoin adoption is likely to continue. However, it does not make it near-term immune to the de-leveraging in the risk asset markets.
Near-term the bias remains bearish on Bitcoin. However, the mid-to-long term remain very bullish for the biggest cryptocurrency.
This article is intended for informational and educational purposes only and does not constitute financial advice. All trading involves risk. Past performance is not indicative of future results.
Trading involves substantial risk. All content is for educational purposes only and should not be considered financial advice or recommendations to buy or sell any asset. Read full terms of service.