Bitcoin Technical Analysis: Key Levels For Investors

Bitcoin rallied again this week, taking out the prior all-time high of $74,000. The move came on the back of the re-election of Donald Trump who has courted crypto investors. With Gary Gensler likely to be fired, crypto investors are re-energized and looking to buy.
Bitcoin taking out the $74,000 resistance level is not surprising. Back in 2021, the April high on Bitcoin was $65,000, then after a sharp correction, it went to $69,000 before a massive bear market took Bitcoin to $15,000.
The big question is; is Bitcoin starting a new bull market or will it drop. Let's take a look at the chart.
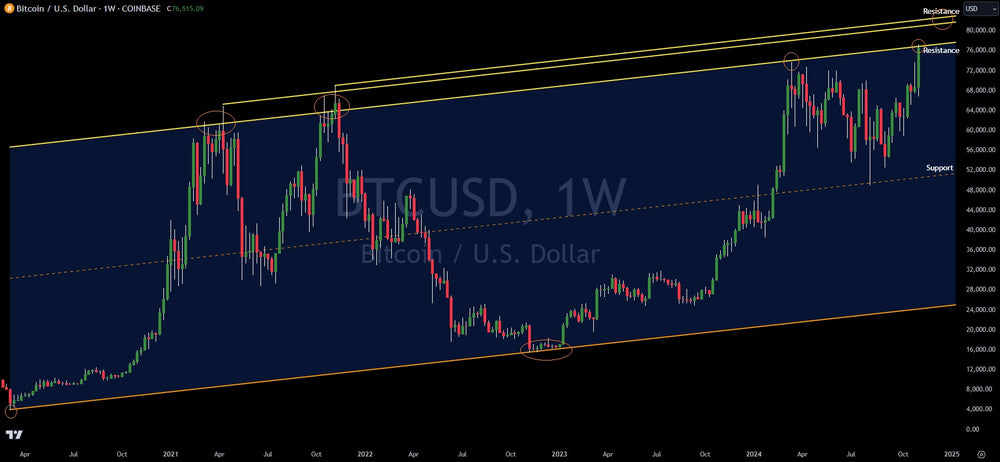
Bitcoin is currently trading between near $77,000. This is into a parallel resistance trend line. As seen in the chart above, the parallel uses the bear market lows of 2020 and 2023 and the bull market highs of 2021 and 2024. This tells investors, Bitcoin is into resistance at $77,000. However, the parallel has some variance based on the exact pivot highs. This means Bitcoin could trade as high as $83,000.
This sends a signal of near-term caution to investors who are expecting $100,000 in 2024. It may take a little more time for those upside mega targets to play out.
Trading involves substantial risk. All content is for educational purposes only and should not be considered financial advice or recommendations to buy or sell any asset. Read full terms of service.


