Bitcoin Technical Analysis: Price Stuck In Parallel Channel
Bitcoin put it its all-time high on May 22nd, 2025 at a price of just above $112,000. Since then, price has pulled back inside a classic parallel channel. In technical analysis, this is a bullish consolidation. This implies a bullish bias. However, as always, it is not so simple.
Historically, Bitcoin has topped 4-6 weeks before the stock market. The stock market just made a new all-time high. So the question has to be asked, is Bitcoin signaling a top that will soon be reflected in the stock market, prior to a bear market? In 2017, Bitcoin topped 4-6 weeks before the stock market fell sharply. In 2021, Bitcoin topped 4-6 weeks before the stock market fell sharply.
Overall, the pattern on Bitcoin is bullish, but investors would be wise to keep their eye on the stock market. With Bitcoin's top being just over 4 weeks ago, investors should know within a week or two.
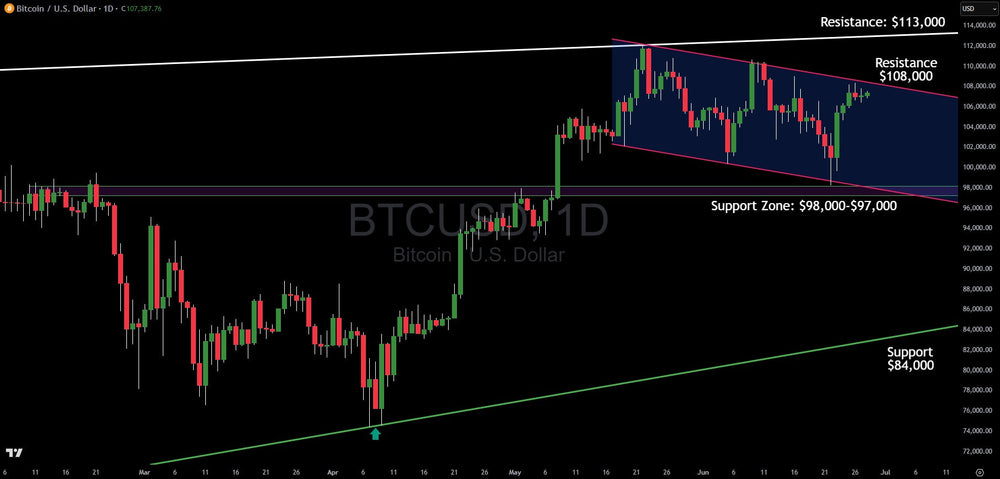
Bitcoin has technical resistance at $108,000. This is the high end of the parallel channel. Should it break that, $113,000 is the next resistance.
If Bitcoin falls, there is major support between $98,000 and $97,000. This is both the lower trend line of the parallel channel as well as a horizontal support zone. The combination of these two should make for a major support level. If that area is broken, the next big level is around $84,000.
Please refer to the chart above for all the levels and a visual.
Written by Gareth Soloway, Chief Market Strategist at www.VerifiedInvesting.com
This article is intended for informational and educational purposes only and does not constitute financial advice. All trading involves risk. Past performance is not indicative of future results.
Trading involves substantial risk. All content is for educational purposes only and should not be considered financial advice or recommendations to buy or sell any asset. Read full terms of service.