Bitcoin Technical Analysis: Resistance Hit, Bitcoin To Likely Pullback
As discussed last week, a bull flag pattern suggested a high probability of a significant upward move in Bitcoin. This scenario played out as predicted, with Bitcoin surging from the $85,000 area to test levels near $96,000, demonstrating the effectiveness of this technical pattern.
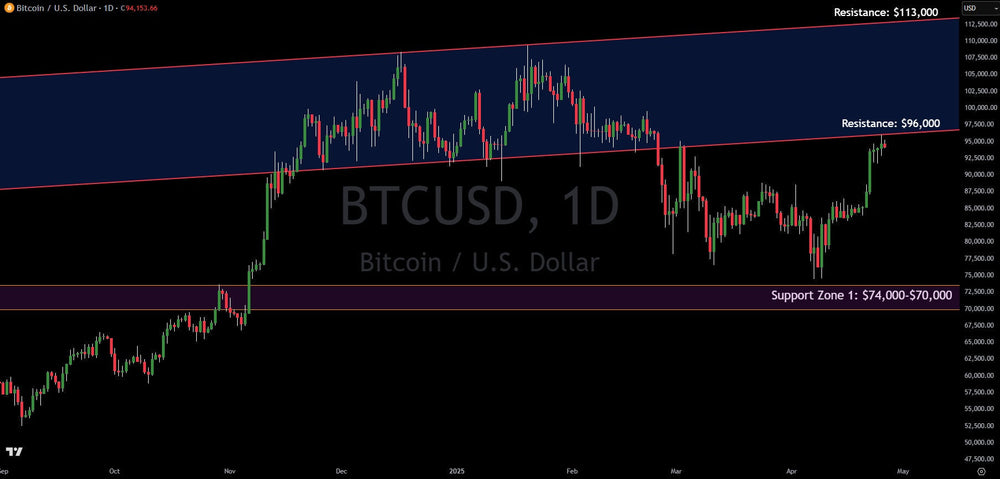
However, the rally has encountered formidable resistance at the $96,000 mark. This level represents a critical multi-year trend line formed by connecting the cycle highs of 2017, 2021, 2024, and the recent 2025 peak. Furthermore, a parallel line drawn beneath this resistance accurately maps the key lows established between November 2024 and February 2025, which acted as support, and also defined the peak of a rebound in early March 2025 (acting as resistance then). Bitcoin's latest advance has returned its price to this primary upper resistance line.
Looking forward, a decisive breach and hold above $96,000 would open the door for a potential move towards the upper parallel trend line, currently situated around $113,000.
Alternatively, rejection at the $96,000 resistance could trigger a retracement. Initial support is expected between $87,500 and $86,500. A deeper correction would target the major support zone of $74,000-$70,000.
Based on the current chart structure, technical analysis favors the probability of a near-term pullback or consolidation below the $96,000 resistance level in the coming week.
This article is intended for informational and educational purposes only and does not constitute financial advice. All trading involves risk. Past performance is not indicative of future results.
Trading involves substantial risk. All content is for educational purposes only and should not be considered financial advice or recommendations to buy or sell any asset. Read full terms of service.