Bitcoin Warning Signs Emerge: Here Are The Chart Levels
After watching Bitcoin surge alongside the broader stock market since April 7th, we're now seeing some concerning divergences that have my attention—and not in a good way. With Bitcoin trading around $104,213 as I write this, the technical picture is starting to flash warning signs that suggest the party might be winding down.
Here's what's got me concerned: while the stock market has been flatlining recently, Bitcoin has actually started to decline. This is classic "risk-off" behavior beginning to creep into the highest-risk assets first, and crypto typically leads the charge when investors start getting nervous.
Let me walk you through what I'm seeing, because this setup suggests we could be heading for some significant downside in the coming weeks.
The Big Picture: Risk Assets Under Pressure
Since April 7th, we've witnessed what many viewed as a coordinated rally across risk assets. Bitcoin, stocks, and other speculative investments all moved higher together in what appeared to be a broad-based risk-on environment. But here's the thing about these correlated moves—when they start to unwind, they tend to unwind fast.
What strikes me as particularly concerning is how Bitcoin is now beginning to diverge from traditional markets. While stocks have managed to hold their ground and trade sideways, Bitcoin is showing clear signs of weakness. In my 26 years of market experience, I've learned that when the highest beta assets start breaking down first, it's often a canary in the coal mine for broader risk sentiment.
This isn't just about Bitcoin—it's about what Bitcoin is telling us about investor appetite for risk. And right now, that appetite appears to be waning.
The Technical Picture: A Pattern Under Siege
Now, let's talk about what the chart is really showing us. Yes, we have an ascending triangle pattern that's been forming over the past several months, but I'm increasingly viewing this through a bearish lens rather than the bullish interpretation many are touting.
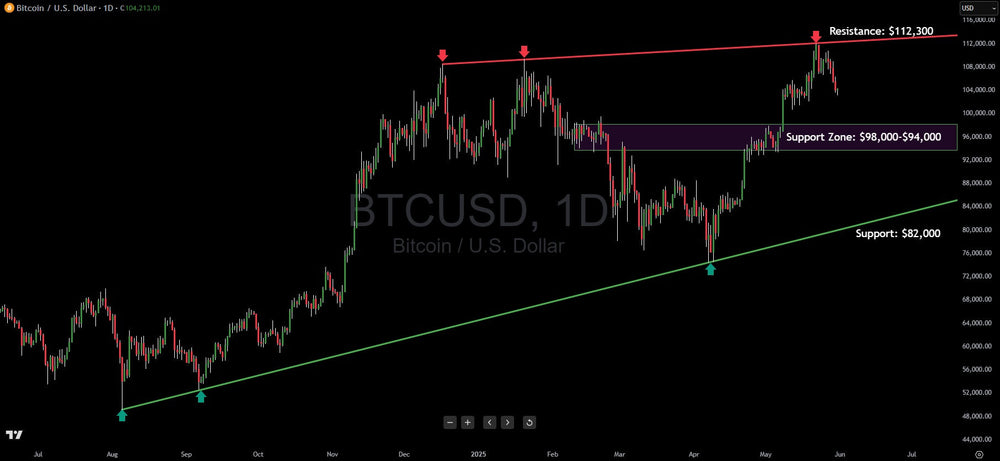
That red ascending trendline connecting the recent highs at $112,300? It's not just resistance—it's becoming a formidable ceiling that's repeatedly rejected Bitcoin's advance attempts. Each time Bitcoin has approached this level, sellers have stepped in with conviction, and the subsequent pullbacks have been telling.
Here's what many bulls are missing: ascending triangles can break down just as easily as they break up, especially when the broader risk environment is shifting. The pattern itself is neutral—it's the context that matters, and the context is increasingly bearish.
The green ascending trendline that's been supporting Bitcoin since the $82,000 level? Well, support levels are only as good as the buying pressure behind them. And with risk-off sentiment beginning to creep in, I'm not convinced that buying pressure will hold when truly tested.
The Critical Zones: Targets, Not Floors
That purple zone with the green outline between $98,000 and $94,000 that many are viewing as rock-solid support? I'm looking at it as our first likely target on the downside. In a risk-off environment, these horizontal support levels often become magnets rather than barriers.
Think about it this way: if institutional money and large holders start reducing their crypto exposure as part of broader portfolio de-risking, they're not going to be particularly interested in defending arbitrary technical levels. They're going to be more focused on liquidity and exit strategies.
The $98,000-$94,000 zone will be where the real battle ensues between bulls and bears. This is where we'll find out if there's genuine conviction behind the buying, or if it's just been algorithmic support and momentum players who will quickly disappear when the tide turns.
Reading the Risk-Off Tea Leaves
What concerns me most about the current setup isn't just the technical pattern—it's the fundamental shift in risk sentiment that's beginning to emerge. When Bitcoin was rallying alongside everything else from April through recently, it was easy to get caught up in the euphoria. But markets don't move in straight lines forever.
The fact that Bitcoin is now showing weakness while traditional markets hold steady is a classic early warning sign. Crypto has always been the highest beta play in the risk spectrum, which means it's typically the first to fall when investors start getting defensive.
We're seeing this play out in real-time. The stock market's recent inability to push meaningfully higher, combined with Bitcoin's emerging weakness, suggests that the risk-on trade that's been working since April might be losing steam.
The Breakdown Scenario: Mapping the Descent
Let's be realistic about what happens if this pattern fails to the downside—which I believe is becoming increasingly likely given the shifting risk environment.
The First Target: $98,000-$94,000 This is where I expect to see the initial test of resolve. If Bitcoin breaks below its current consolidation pattern, this support zone becomes the logical first target. But here's the key question: will buyers actually show up there with conviction, or will they be overwhelmed by selling pressure from nervous holders looking to reduce risk?
The Secondary Target: $82,000 If that critical support zone fails—and in a risk-off environment, support levels tend to fail more often than hold—then we're looking at a potential test of that major ascending trendline around $82,000. This would represent a significant breakdown of the entire pattern structure.
A move to $82,000 wouldn't just be a technical breakdown; it would likely trigger a cascade of stop-losses and forced selling from leveraged positions. In crypto, these moves tend to feed on themselves once they get started.
The Upside: Increasingly Limited
On the flip side, let's talk about the upside potential—or lack thereof. That $112,300 resistance level isn't just a number on a chart; it's becoming a genuine ceiling that's been tested multiple times without success.
Each failed attempt to break above this level weakens the bullish case and strengthens the bearish argument. It tells us that sellers are well-organized and motivated at these levels, while buyers are becoming increasingly reluctant to chase prices higher.
In the current risk environment, I see upside as severely capped. Even if Bitcoin manages to rally from current levels, I'd expect that red ascending trendline to act as formidable resistance. The risk-reward equation simply doesn't favor the bulls right now.
Volume and Momentum: The Missing Ingredients
One thing that's particularly concerning is the character of the recent price action. We're not seeing the kind of volume and momentum that typically accompanies healthy market structures. Instead, we're seeing what looks like distribution—smart money quietly reducing positions while retail investors remain optimistic.
The rallies have been getting weaker, the pullbacks more persistent. This is classic topping behavior, especially when combined with the broader shift in risk sentiment we're witnessing across markets.
What the Correlation Breakdown Means
Here's something that really has my attention: Bitcoin's recent divergence from traditional risk assets. For months, crypto has been trading in lockstep with stocks and other risk assets. When that correlation breaks down—especially with crypto showing relative weakness—it's often a sign that crypto is anticipating something that traditional markets haven't fully recognized yet.
This breakdown in correlation suggests that crypto-specific selling pressure is beginning to emerge. Whether it's profit-taking from the April rally, regulatory concerns, or simply portfolio rebalancing, the message is clear: Bitcoin is no longer getting the benefit of broad-based risk appetite.
Risk Management in a Changing Environment
Given this shifting landscape, risk management becomes absolutely critical. The bullish case that many were making just weeks ago is looking increasingly fragile, and traders need to adjust their expectations accordingly.
For anyone holding Bitcoin here, I'd be watching that $98,000-$94,000 zone like a hawk. A break below this level would confirm that the risk-off trade is gaining momentum and suggest that further downside is likely.
For traders looking to position for the downside, the same zone provides a logical level for stop-losses on short positions. But given the broader risk environment, I'd expect any bounces to be met with selling pressure rather than renewed buying interest.
The Warning Signs Are Clear
After 26 years in these markets, I've learned to pay attention when multiple warning signs start flashing simultaneously. Right now, we have:
- Bitcoin showing weakness while traditional markets hold steady
- Failed attempts to break above key resistance at $112,300
- A broader shift from risk-on to risk-off sentiment
- Weakening momentum and concerning volume patterns
- A breakdown in the correlation that's been supporting crypto
These aren't isolated incidents—they're part of a broader pattern that suggests Bitcoin could be in for some significant downside in the coming weeks.
The Road Ahead: Expect Turbulence
So where does this leave us? I believe we're likely heading for a test of that $98,000-$94,000 support zone sooner rather than later. The question isn't if, but when—and whether buyers will show up with enough conviction to hold the line.
If they don't—and given the shifting risk environment, I'm not optimistic—then $82,000 becomes the next logical target. That would represent a significant breakdown of the entire technical structure and likely trigger additional selling pressure.
The upside? It's capped. That $112,300 resistance level has proven too tough to crack in a favorable environment. In an increasingly unfavorable one, it's likely to remain a formidable ceiling.
The Bottom Line
The market is sending us signals, and right now, those signals are cautionary. The risk-on trade that powered Bitcoin higher since April appears to be losing steam, and crypto—as the highest beta asset in the risk spectrum—is likely to feel the effects first and most severely.
This doesn't mean Bitcoin is going to zero, or that the long-term bull case is dead. But it does mean that the near-term path of least resistance appears to be lower, not higher. The smart money seems to be positioning accordingly, and retail investors would be wise to take notice.
In markets like these, preservation of capital becomes more important than pursuit of profits. The trend is shifting, the risk environment is changing, and Bitcoin's technical pattern is looking increasingly vulnerable.
As I always tell my clients: when the market gives you warning signs, it's usually wise to listen. Right now, those warning signs are flashing red.
Gareth Soloway is Chief Market Strategist at VerifiedInvesting.com with over 26 years of trading experience. His analysis has been featured on Bloomberg, Schwab, and major financial media outlets. Follow his insights at VerifiedInvesting.com.
This article is intended for informational and educational purposes only and does not constitute financial advice. All trading involves risk. Past performance is not indicative of future results.
Trading involves substantial risk. All content is for educational purposes only and should not be considered financial advice or recommendations to buy or sell any asset. Read full terms of service.