Bitcoin's Powerful Surge: Key Support and Resistance Levels
Summary of Article: Bitcoin surged higher in the latest week, breaking the key trend line that was support, then became resistance at $93,400. If the stock market momentum continues, Bitcoin could rally to the $109,000, all-time high and potentially as high as $112,000. Any sort of stock market sell-off would likely bring Bitcoin back to its breakout level of $93,400, now support.
Bitcoin's Powerful Surge: Key Support and Resistance Levels Traders Need to Watch
Bitcoin has made a decisive move this past week, breaking above crucial resistance and surging higher in an impressive display of strength. The cryptocurrency has rallied sharply from the $94,000 area to over $103,500, gaining momentum alongside the broader stock market rally. This powerful move has established clear trading levels that savvy investors should be watching closely. Let's analyze the key support and resistance zones that will likely determine Bitcoin's next moves.
The Big Picture: Clear Trading Ranges Emerging
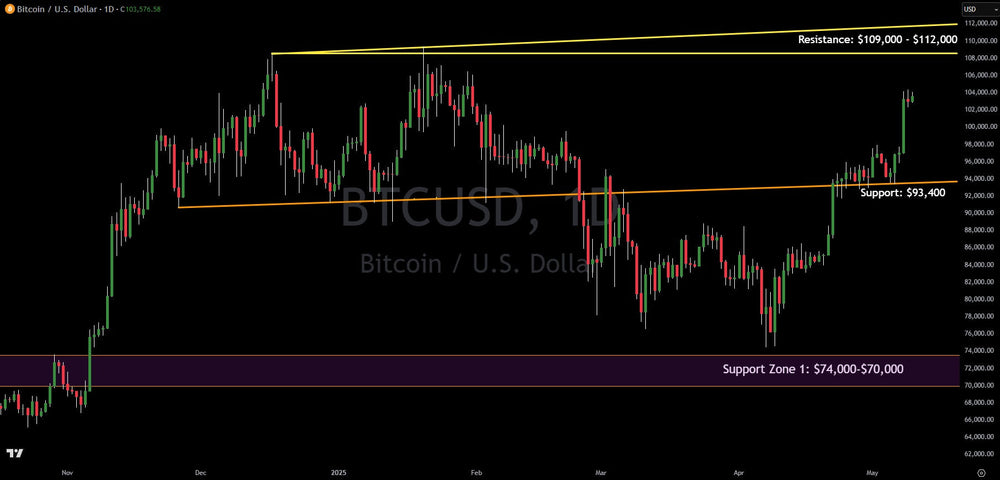
Bitcoin has been on quite the journey over the past six months. Looking at our daily timeframe chart, we can see that after reaching all-time highs around the $109,000 mark in early 2025, BTC experienced a significant pullback that bottomed in the $74,000-70,000 zone. This price action has created a fascinating technical structure that's now playing out.
What strikes me most about this chart is how Bitcoin has respected both its established support and resistance levels with remarkable precision. This kind of technical obedience gives us valuable clues about potential future movements and key decision points for traders.
Support Structure: The Foundation of the Current Rally
Let's dig into what's holding Bitcoin up right now. The chart clearly shows two critical support zones that have provided the launching pad for the current move.
First, we have the ascending support trendline (marked in orange/gold on our chart) that's currently sitting at approximately $93,400. This isn't just any trendline – it has been in play since late 2023 and has repeatedly proven its significance. Notice how price has tested this level multiple times throughout 2024 and early 2025, bouncing higher almost every time? That's the hallmark of a powerful support zone.
The price action in late April was particularly telling. Bitcoin found its footing precisely at this trendline support, coiling like a spring before launching into the current upward movement. This wasn't coincidental – it represents institutional and retail traders collectively recognizing this level as value.
Below that, we have our major support zone between $74,000-$70,000 (marked in purple). This area represents Bitcoin's ultimate safety net in the current market structure. When prices plunged in March-April 2025, this zone absorbed the selling pressure beautifully, creating the foundation for recovery. The fact that Bitcoin didn't spend much time in this zone tells me there was significant buying interest just waiting for this discount.
Resistance Ahead: The Battle for $109,000-$112,000
Now for the challenging part of our journey. Bitcoin is climbing toward a formidable resistance zone between $109,000-$112,000 (marked by the yellow band at the top of our chart). This area has historic significance as it contains the previous all-time highs and has already rejected price advances earlier this year.
Think of this resistance zone as a ceiling with weight bearing down on price. Each approach to this level will likely bring increased selling pressure as traders who bought the previous top look to break even, and others take profits from the recent rally.
What makes this resistance particularly interesting is its multi-touch history. The market has tested this level several times, creating a well-defined price ceiling. Breaking through won't be easy – it will require significant buying pressure and likely a catalyst beyond the technical picture.
The Stock Market Connection: Bitcoin's Not Alone in This Dance
Here's where things get even more interesting. Bitcoin's recent surge hasn't happened in isolation. As a risk asset, Bitcoin continues to show strong correlation with traditional equity markets. The stock market rally has provided the tailwind for Bitcoin's recent performance.
This relationship creates both opportunity and risk. On one hand, continued strength in equities could help push Bitcoin through that stubborn resistance level. On the other hand, this dependency means that even if Bitcoin's technical picture looks bullish, a sudden stock market correction could quickly undermine support.
My experience tells me to watch this correlation carefully. When Bitcoin and stocks move in lockstep, the technical levels we've identified become even more important as confirmation points rather than standalone triggers.
Volume Analysis: Confirming the Move?
While not explicitly marked on our chart, volume behavior during this recent rally provides additional context. The surge from $94,000 to current levels around $103,500 has seen above-average volume, suggesting genuine buying interest rather than a mere technical bounce.
However, for Bitcoin to successfully challenge the $109,000-$112,000 resistance zone, we'd ideally want to see progressively increasing volume as price approaches this level. This would indicate growing conviction among buyers – something that's often needed to break through established resistance.
Potential Scenarios: What's Next for Bitcoin?
Based on this technical structure, I see three primary scenarios unfolding:
Scenario 1: Breakthrough and Retest If Bitcoin can close decisively above $112,000 (preferably on strong volume), we could see a significant continuation move. The resistance zone would likely flip to become support, and after a potential retest of the $109,000-$112,000 area, Bitcoin could target new all-time highs around $125,000-$130,000.
Scenario 2: Rejection and Range Formation If Bitcoin gets rejected at the resistance zone, which is a distinct possibility given its historical significance, we might see a pullback toward the ascending trendline support at $93,400. This would establish a high-timeframe range between these two levels, potentially creating swing trading opportunities within a $93,400-$112,000 channel.
Scenario 3: Deeper Correction on Market Weakness If broader markets weaken substantially, Bitcoin could break below the ascending trendline support, which would signal a deeper correction. In this scenario, the $74,000-$70,000 support zone becomes critical. A break below this zone would significantly alter the bullish market structure that's been developing.
Trading Strategy: How to Play These Levels
Let's talk specific trading approaches for these clearly defined levels – after all, identifying key zones is only useful if you know how to profit from them.
For bullish traders looking to capitalize on potential upside:
- Consider entering long positions on pullbacks to the $93,400 support trendline
- Place stops just below this trendline (perhaps around $91,500) to clearly define risk
- Target the upper resistance zone of $109,000-$112,000 for taking profits
- Consider scaling out of positions as price approaches this major resistance
For bearish or countertrend traders:
- The $109,000-$112,000 zone presents a high-probability area to consider short positions
- Place stops just above the upper resistance (around $113,500) to manage risk
- Target the $93,400 trendline support for potential profit-taking
- Watch for signs of rejection at resistance (bearish candles, volume spikes) for confirmation
For the more conservative trader, waiting for either a confirmed breakout above resistance or a bounce from support provides higher probability setups, even if it means sacrificing some potential profit for increased certainty.
Remember that with Bitcoin's correlation to the stock market, combining this technical approach with awareness of broader market conditions can significantly improve your trading results. Position sizing appropriate to these clearly defined risks is essential for long-term success.
Conclusion: Trading the Clearly Defined Levels
Bitcoin's technical picture provides traders with exceptionally well-defined levels to work with. The cryptocurrency has carved out clear support and resistance zones that offer high-probability trading opportunities in both directions.
For traders looking to capitalize on this structure, the resistance zone between $109,000-$112,000 offers a potential selling opportunity with a clearly defined risk level just above. Conversely, any pullbacks to the ascending support trendline around $93,400 present a potential buying opportunity with clear invalidation below.
What makes Bitcoin particularly attractive right now is how cleanly it's respecting these technical levels. The market has provided us with a well-defined roadmap, giving traders precise entry, exit, and risk management points.
Remember that Bitcoin's continued correlation with the stock market adds another dimension to this analysis. Keep a close eye on broader market movements as they will likely influence Bitcoin's ability to break resistance or hold support.
With these levels clearly identified, the question becomes: which side of these trades will you be positioning for?
Written by Chief Market Strategist Gareth Soloway at VerifiedInvesting.com
This article is intended for informational and educational purposes only and does not constitute financial advice. All trading involves risk. Past performance is not indicative of future results.
Trading involves substantial risk. All content is for educational purposes only and should not be considered financial advice or recommendations to buy or sell any asset. Read full terms of service.