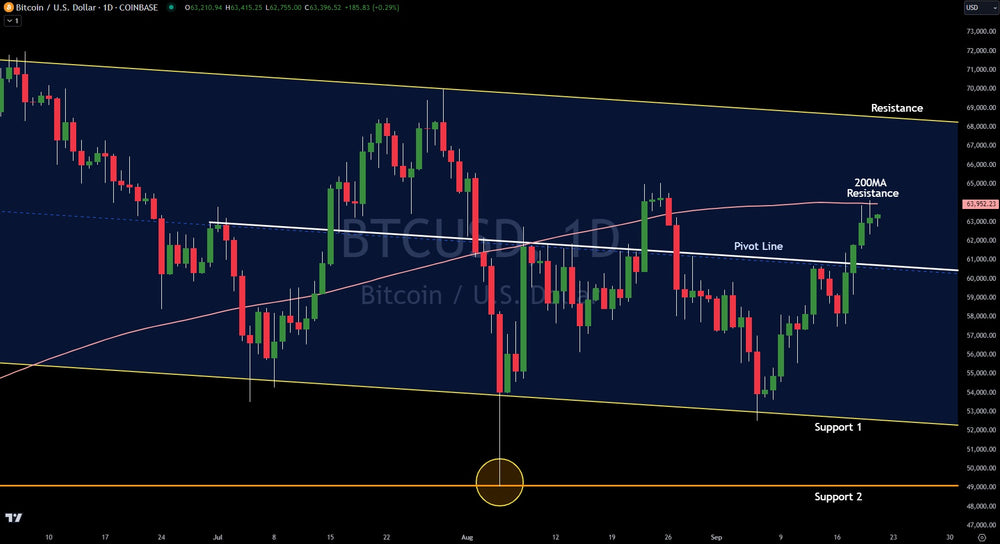
Chart Analysis: Key Levels On Bitcoin

Bitcoin jumped over the last week, breaking through the bullish/bearish pivot line and confirming. This changes the near-term bias to bullish from bearish based on technical analysis. It does not mean Bitcoin will go straight up, but pull backs into support are buying opportunities now.
The only thing that would change the bullish bias on Bitcoin is if the pivot line is confirmed back below. Then investors and traders need to move to the sidelines as price could decline quickly to $52,000 and even as low as $49,000.
Bitcoin has stalled at the current $64,000 level. The technical reason for the stall is the daily 200 simple moving average. Should it break above, there is no major resistance until $68,500.
Overall, Bitcoin continues to show a lot of relative strength compared to altcoins. Bitcoin dominance continues to move higher. The recent upside can be attributed to risk-on in the stock market. The S&P 500 made a new all-time high in the last week, keeping investors buying risky assets such as crypto.
Verified Investing is a data and chart analysis company. There is no room in the world of investing for emotion driven by mainstream media narratives and the hype of social media. When investors follow the data and charts, they put the probabilities in their favor and can consistenly make the right investing decisions. Verified Investing is here to support the retail investor.
Trading involves substantial risk. All content is for educational purposes only and should not be considered financial advice or recommendations to buy or sell any asset. Read full terms of service.


