Ethereum Chart Analysis And Expected Price Action

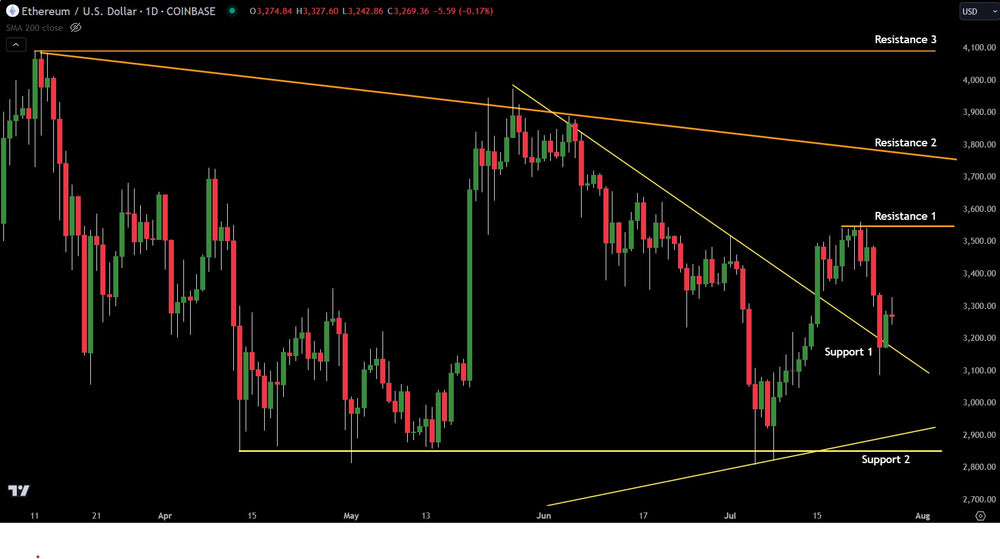
Cryptocurrency Ethereum struggled in the latest week. Following the launch of five spot ETF's, Ethereum dropped from $3,550 to $3,100 before rebounding slightly.
One of the main issues was bad timing. The NASDAQ (risk assets) had its biggest down day since October 2022. This triggered de-risking. ETF buyers sold the ETF after buying the day prior on the launch. The day of launch there were $100 million of inflows. The following day, with the NASDAQ dropping 3.6%, there were $108 million of outflows.
To have more outflows than inflows on the second day was a black eye for Ethereum and caused additional selling.
Utlimately, Ethereum has stabilized but all eyes have to remain on the NASDAQ and risk assets. If they continue to sell, Ethereum is likely to struggle.
Based on pure technical analysis, Ethereum fell sharply but held its Support 1 at $3,100. This level was given last week as the key support price if it fell. It was dead-on. If selling resumes and causes a break of this technical chart support, the next level to watch is $2,900.
On the upside, the recent highs at $3,550 are resistance. Should Ethereum surge through it, resistance will be $3,750, followed by $4,100.
Overall, the bias remains neutral but with a wary eye to the stock market's performance. Mega cap tech is struggling and may continue. That would be a net negative for Ethereum.
Trading involves substantial risk. All content is for educational purposes only and should not be considered financial advice or recommendations to buy or sell any asset. Read full terms of service.


