Ethereum Forms Bullish Consolidation Pattern After Finding Support at $1,380
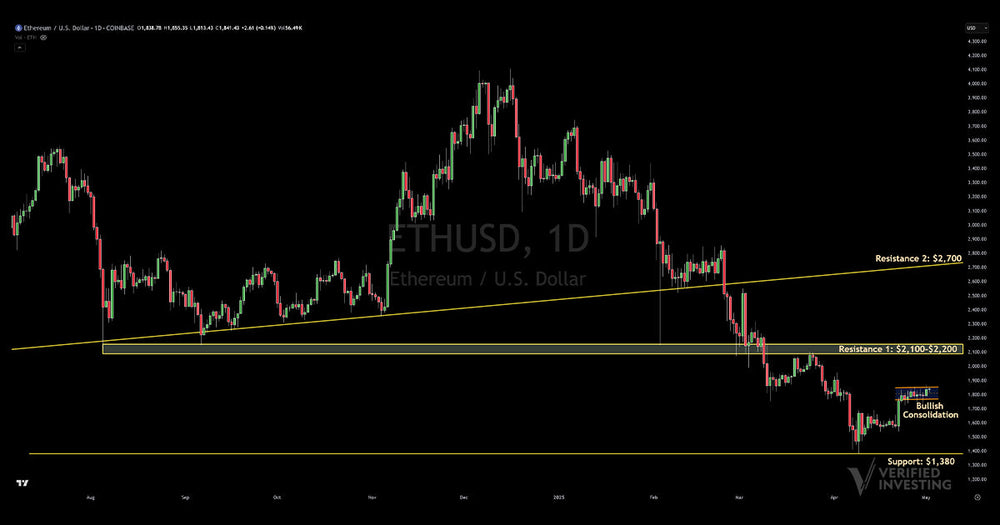
Ethereum (ETH) has experienced a significant downturn since reaching highs near $4,100 in December 2024, declining approximately 66% to recent lows. The selloff accelerated in February 2025 when ETH broke below its long-term uptrend line (yellow) that had provided support since September 2023. This breakdown proved decisive, triggering further selling that eventually found a bottom at the $1,380 support level in April.
The daily chart now shows ETH forming what appears to be a bullish consolidation pattern near the $1,650 level. This rectangular formation suggests accumulation is occurring after the steep decline, with buyers stepping in at these lower price levels. While this pattern suggests potential upside, ETH faces significant resistance hurdles on any recovery attempt. The first major resistance zone sits at $2,100-$2,200, which aligns with previous price action from February-March. Beyond that, the $2,700 level (marked as Resistance 2) represents another critical barrier where selling pressure is likely to intensify.
For traders looking to position for potential upside, the bullish consolidation pattern provides a clear risk management framework. The $1,380 support level serves as a crucial line in the sand—a decisive break below would invalidate the bullish setup and potentially lead to further downside. However, if the consolidation resolves to the upside with a breakout above $1,850, it could signal the beginning of a recovery toward the first resistance zone. The rectangular consolidation pattern typically suggests a measured move equal to the height of the pattern, implying a potential target of $1,950-$2,000 on a confirmed breakout.
This article is intended for informational and educational purposes only and does not constitute financial advice. All trading involves risk. Past performance is not indicative of future results.
Trading involves substantial risk. All content is for educational purposes only and should not be considered financial advice or recommendations to buy or sell any asset. Read full terms of service.