Ethereum: Institutional Level Technical Analysis

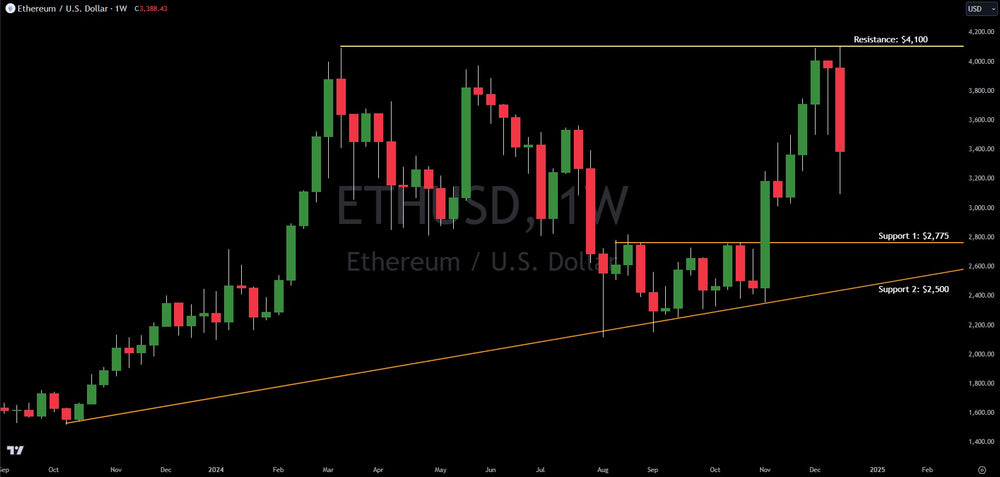
Ethereum's breathtaking 74% surge came to a halt as it encountered strong resistance at the $4,100 level, precisely as predicted in our previous technical analysis. This rejection triggered a sharp 25% correction, sending the price tumbling down to $3,100. This price action underscores the value of technical analysis in navigating volatile markets and making informed investment decisions.
Looking ahead, Ethereum finds itself at a critical juncture. If the selling pressure persists, strong support awaits at $2,775. This price point is not only a major historical support level but also aligns with the 78.6% Fibonacci retracement level. The confluence of these two technical indicators creates a formidable barrier against further decline.
Should this support level be breached, another crucial support zone lies at $2,500. This dynamic support level, characterized by its upward slope, is gradually converging with the $2,775 level. This convergence is poised to form one of the most significant support zones in Ethereum's recent history, potentially sparking a strong rebound.
On the upside, the $4,100 level remains the key resistance to overcome. A decisive break above this level would open the door for a potential rally towards Ethereum's all-time high near $5,000.
At Verified Investing, we're committed to empowering retail investors with the same high-quality, institutional-grade analysis that hedge funds and investment banks rely on. We believe everyone deserves access to sophisticated market insights, and we're proud to offer this valuable resource for free. By utilizing technical analysis, investors can cut through the noise, avoid emotional decision-making, and achieve their financial goals.
Trading involves substantial risk. All content is for educational purposes only and should not be considered financial advice or recommendations to buy or sell any asset. Read full terms of service.


