Latest Bitcoin Technical Analysis: Trading Levels

Bitcoin has surged 35% in November. This monster move began with the election of Trump as the next president of the United States. His dovish bias toward crypto was the ignition. Add in Gary Gensler resigning, and it is a match made in heaven, at least so far.
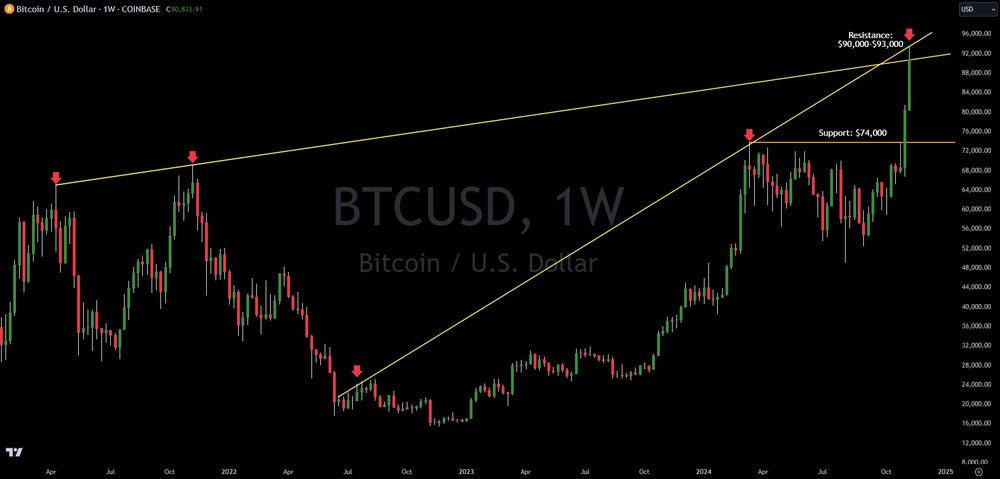
Since March of 2024, Bitcoin had been in a consolidation phase. After making a high near $74,000 in March, it had chopped sideways to lower, reaching $49,000.
Once the former all-time high of $74,000 was breached, Bitcoin was in breakout territory. The up-move on Bitcoin has taken it to major resistance between $90,000 and $93,000. This resistance zone is comprised of a trend line that connects perfectly through the $65,000 April 2021 high and the $69,000 November 2021 high. When that line is extended out, it goes right to this $90,000-$93,000 level. In addition, there is a trend line connecting highs from 2022 and 2024 that reach this same level, creating more resistance. It can be seen in the chart above.
If Bitcoin can breakout above this resistance, there is no major level until $100,000-$101,000.
Bitcoin support is easy to identify. When a former all-time high is broken out above, it becomes support on the way back down. This means $74,000 is major support, should Bitcoin dump. This would be considered a near-term buying opportunity.
Verified Investing shatters the information barrier, equipping everyday investors with the sophisticated tools and data-driven insights previously reserved for Wall Street elites. We replace emotional biases and hype with the cold, hard facts of technical analysis, empowering you to make informed decisions with unwavering confidence. In a world awash with misleading narratives, Verified Investing is the beacon of clarity, illuminating the path to financial success.
Trading involves substantial risk. All content is for educational purposes only and should not be considered financial advice or recommendations to buy or sell any asset. Read full terms of service.


