Latest: Technical Analysis On Bitcoin

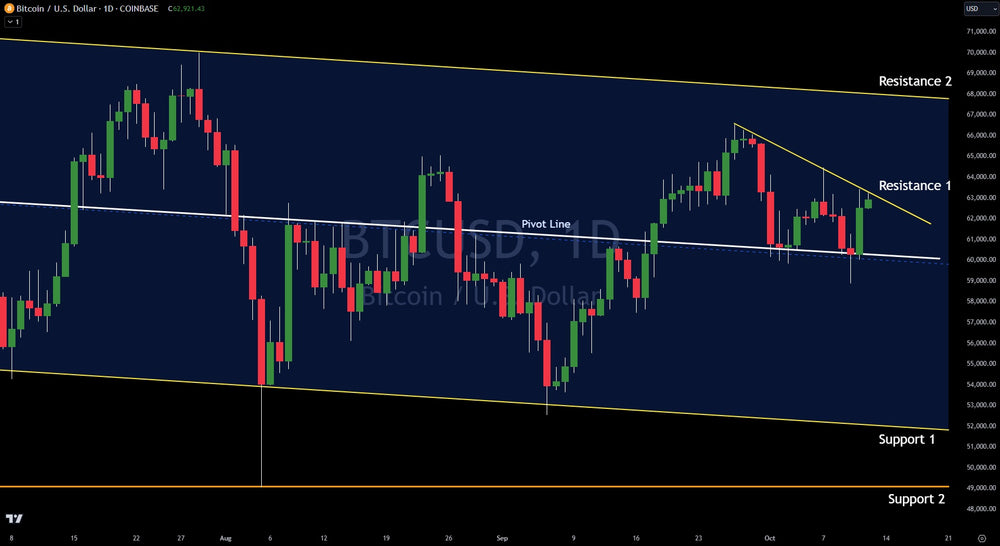
Bitcoin traded in an 8% range over the last week. Early in the week, Bitcoin saw some heavy selling as it underperformed other risk assets like the NASDAQ and S&P 500. After flushing intra-day below the major pivot line of support at $60,000, it recaptured it, then surged higher to its current $63,000.
The pivot line has been a masterful level of support and resistance on Bitcoin for months. The pivot line represents the middle of a paralell channel that starts at the all-time highs back in in March 2024.
As long as Bitcoin does not close and confirm below the pivot line (which currently sits at $60,000), it remains in the bullish bias zone overall. However, it has traded up to a minor resistance level at $63,100. Should it push through this level, upside could be seen to $68,000.
If Bitcoin breaks and confirms below the pivot line at $60,000, downside would be switch with little support until $52,000 and then $49,000.
Overall, Bitcoin has been underperforming the stock market which is a concern. Generally, Bitcoin does 3-4x whatever the S&P 500 does. However, Bitcoin made its last all-time high in March 2024 and the S&P 500 made a new all-time high just this past Friday. This shows that the risk asset of crypto is being discounted by investors in the current environment. This could be because inflation has come down substantially and also due to the growing excitement over gold.
Using technical analysis, traders and investors can use probability to put themselves on the right side of a majorit of trades. Verified Investing helps investors look at charts and assets objectively, avoiding narratives and hype.
Trading involves substantial risk. All content is for educational purposes only and should not be considered financial advice or recommendations to buy or sell any asset. Read full terms of service.


