Latest: Technical Analysis On Ethereum
Ethereum continued to trade in a tight range over the last week. In fact, in the last seven trading days it stayed within a 7% range (highest point to lowest point).
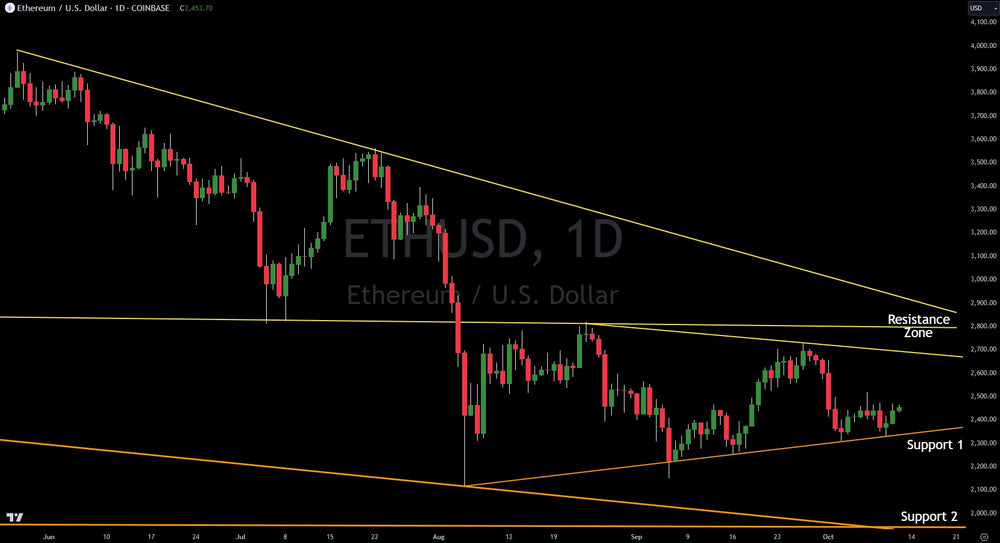
The price of Ethereum continues to bounce on a trend line of support that starts at the pivot low on August 5th, 2024. As seen in the chart above, Ethereum has tagged this up-sloping line five times. Per the methodology, this trend line is weakening significantly. Should Ethereum hit it again, it would have a 75%-80% chance of breaking. The trend line currently sits at $2,350.
Should this trend line break at $2,350, there is no major support until $1,900-$2,000.
As of now, the $2,350 level is holding and price has bounced to $2,450. Price has no major resistance until a major resistance zone between $2,680 and $2,880. There are three major trend lines that converge in this area, making it an epic resistance zone.
Overall, a technical trader respects support and resistance until broken.
Verified Investing is here for the retail investor, giving them technical analysis that is unbiased and usually reserved for institutions. Usually, retail looks to mainstream financial media for insights, but even that has a narrative. In addition, social media is filled with hype and will make investors panic sell or buy. Ultimatley, investors should be looking for high probability trades based on technical analysis.
This article is intended for informational and educational purposes only and does not constitute financial advice. All trading involves risk. Past performance is not indicative of future results.
Trading involves substantial risk. All content is for educational purposes only and should not be considered financial advice or recommendations to buy or sell any asset. Read full terms of service.