Latest Update: Chart Analysis On Bitcoin
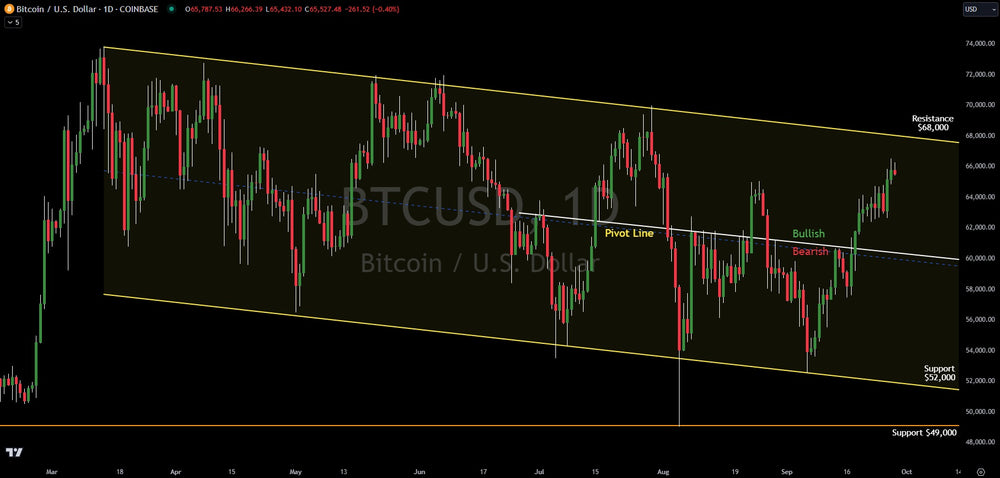
Bitcoin has gained approximately 3.5% in the last week, a continued bullish move after it broke above the pivot line at $60,000 two weeks ago. Per the analysis given here, once the pivot line was taken out above $60,000, upside was likely to $68,000. Bitcoin has so far reached $66,600.
Since the low on September 6th, Bitcoin has gained 24%. However, the big test will be at the $68,000 level. This level is a major trend line (part of the down-sloping channel). If Bitcoin can break above that, a new all-time high would likely be seen in days.
Should risk-off hit the stock market and Bitcoin sells hard, support will be back at the bullish/bearish pivot line at $60,000. If that were to break, downside support is at $52,000-$49,000.
The biggest risk for Bitcoin is not Bitcoin itself, but the stock market. The correlation between Bitcoin and the stock market is almost identical of late. Should economic news make investors question the soft landing narrative, risk assets, including Bitcoin could drop sharply.
Technical traders will be buying pullbacks to $60,000. However, should $60,000 break, they will quickly stop out and look to rebuy at $52,000-$49,000.
Verified Investing analyzes the data and technical analysis. There are no narratives like the mainstream media or hype like on social media. The charts are truth and they give investors probability. Make decisions based on probability and become the casino versus the gambler.
This article is intended for informational and educational purposes only and does not constitute financial advice. All trading involves risk. Past performance is not indicative of future results.
Trading involves substantial risk. All content is for educational purposes only and should not be considered financial advice or recommendations to buy or sell any asset. Read full terms of service.