Solana (SOL) Technical Analysis And Key Insights For Traders
When high-flying assets start stumbling, smart money pays attention. Solana (SOL), the blockchain darling that captured hearts with its lightning-fast transactions and minimal fees, is now telling us a story that extends far beyond crypto markets. As I examine SOL's daily chart, what strikes me isn't just the technical breakdown we're witnessing, but what this price action reveals about the broader risk-off sentiment that's quietly taking hold across financial markets.
Let me walk you through what the charts are saying—and why this matters for anyone watching traditional markets as well.
To get Gareth's swing trade alerts on crypto, with exact entry and exits, sign up for Smart Money Crypto. In addition Gareth does two weekly analysis videos with key levels, setups he is watching and key institutional insights. Chief Market Strategist is joined by his team of top traders who handle additional parts of Smart Money Crypto like the Altcoin Advantage and the HODLer. Sign up at the link below.
Sign up for Smart Money Crypto Here
The Technical Picture: Support Tested, Bulls Defending
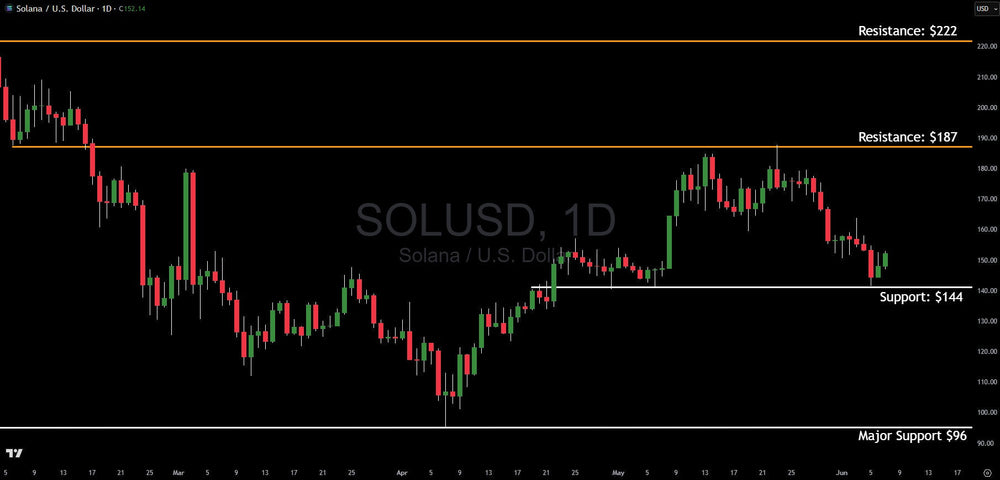
SOL is currently trading around $152, sandwiched between some absolutely critical levels that have shaped its recent destiny. The most immediate concern? We've just witnessed a decisive test of the $144 support zone, marked clearly on our chart as a white horizontal line that's proven its mettle multiple times over recent months.
Here's what caught my attention: after SOL tumbled from the $187 resistance level (our orange line), it didn't just drift lower—it fell with conviction, ultimately kissing that $144 support before staging what can only be described as a tentative bounce. This isn't the kind of price action you see when buyers are chomping at the bit to get in. Instead, it feels more like a market that's lost some of its swagger.
The broader technical landscape paints an even more intriguing picture. Above us, that $187 resistance has acted like a brick wall, repeatedly turning back attempts to push higher. But it's the $222 major resistance level that really tells the story of where this market's ambitions once lay. That level, sitting pristinely untested in recent months, represents the kind of breakout target that would signal a return to SOL's glory days.
On the downside, if $144 gives way, the next meaningful support doesn't appear until we reach the $96 major support level at the bottom of our chart. That's a substantial drop that would represent not just a technical breakdown, but a fundamental shift in how the market values this particular blockchain ecosystem.
Understanding Solana: The Blockchain Built for Speed
Before we dive deeper into what this price action means, let's talk about what exactly we're analyzing here. Solana isn't just another cryptocurrency—it's a high-performance blockchain platform that was designed from day one to solve the scalability problems that have plagued networks like Ethereum.
Think of Solana as the Formula 1 race car of blockchains. Where Ethereum processes about 15 transactions per second, Solana can handle thousands, with transaction fees that typically cost less than a penny. This speed comes from an innovative approach called Proof-of-History, which essentially timestamps transactions before they're verified, creating a more efficient consensus mechanism.
The real-world applications are compelling. Solana powers everything from decentralized finance applications to NFT marketplaces, gaming platforms, and even enterprise solutions. Major companies are using Solana to tokenize real-world assets, while millions of businesses can now accept Solana payments through platforms like Shopify. According to recent data, a staggering 81% of all decentralized exchange transactions occur within the Solana ecosystem.
But here's what makes SOL particularly interesting from a trading perspective: it's what I call a "risk-on" asset within the crypto space. When investors are feeling bullish about technology, growth, and speculative investments, SOL tends to outperform. When they're not—well, that's exactly what we're seeing play out on this chart.
The Broader Market Message: De-Risking in Real Time
Now, here's where things get really interesting from a market psychology standpoint. SOL's recent weakness isn't happening in isolation. As traditional stock markets have essentially flatlined over recent weeks—neither breaking to new highs nor experiencing any meaningful corrections—we're witnessing what I call "silent de-risking."
This is crucial to understand. When institutional investors and sophisticated traders start feeling uncertain about market direction, they don't always announce it with dramatic selling. Instead, they quietly reduce exposure to their highest-risk positions first. In the crypto space, that often means tokens like SOL get hit before Bitcoin, just as growth stocks might underperform before value stocks show weakness.
What we're seeing with SOL could very well be the canary in the coal mine for broader market sentiment. The fact that it's struggled to maintain momentum above $187, combined with its failure to even approach the $222 resistance, suggests that the risk appetite that drove much of 2024's gains may be waning.
This pattern is particularly noteworthy because it's occurring as traditional markets have stalled. When both high-risk crypto assets and conventional stocks are struggling simultaneously, it often precedes more significant market adjustments. The psychology is straightforward: if investors aren't confident enough to push speculative assets higher, they're probably not confident enough to drive the broader market to new extremes either.
Psychology and Price Action: The Fear-Greed Pendulum
I've been watching markets for over two decades, and one thing that never changes is how human psychology drives price action. Right now, SOL's chart is exhibiting classic signs of what happens when greed transforms into caution, and caution edges toward fear.
Look at how price has interacted with our key levels. The rejection at $187 wasn't a gentle pause—it was decisive. That tells me sellers were waiting at that level, ready to distribute to anyone willing to buy at higher prices. Similarly, the test of $144 support followed by only a modest bounce suggests that buyers, while present, aren't exactly fighting each other to accumulate at these levels.
This is textbook market behavior when sentiment is shifting and the most successful traders I know have learned to recognize these subtle changes in market character long before they become obvious to everyone else. Major market tops aren't usually formed by dramatic crashes—they're built through exactly this kind of distribution process, where assets gradually lose their ability to make new highs while support levels become increasingly challenged.
Potential Scenarios: What's Next for SOL?
Given the current technical setup, I see several possible paths forward for SOL, each with different implications for both crypto markets and traditional investments.
Scenario One: The Bounce Continues If SOL can build on its recent bounce from $144 and reclaim the $160-170 area with conviction, it would suggest that buyers are still willing to step in at reasonable valuations. A sustained move above $170 could set up a test of that $187 resistance, though I'd want to see significant volume confirmation before getting too excited about upside potential.
Scenario Two: Support Breakdown A failure to hold $144 would be technically significant and could trigger a more substantial decline toward the $120-130 area, with $96 representing the ultimate downside target based on our chart markups. This scenario would likely coincide with broader risk-off sentiment across markets.
Scenario Three: Prolonged Consolidation Perhaps most likely in the near term, SOL could continue to chop around between $144 and $187, reflecting the broader uncertainty we're seeing in risk assets. This kind of sideways action often precedes more decisive moves in either direction.
Risk Management and Invalidation Points
For anyone considering SOL from a trading perspective, the levels on this chart provide clear guideposts for risk management. A daily close below $144 would invalidate the current support thesis and suggest that lower prices are likely. Conversely, a convincing break above $187 with sustained follow-through would shift the technical outlook back to a more constructive stance.
What's particularly important to understand is that SOL's fate isn't just about blockchain adoption or technological improvements—it's intrinsically linked to broader market risk appetite which affects everything. In an environment where traditional markets are showing signs of fatigue and institutional investors are becoming more selective, high-beta assets like SOL face headwinds regardless of their fundamental merits.
The Bigger Picture Warning
Here's what really keeps me up at night: when assets like SOL start showing this kind of distribution pattern while traditional markets remain near all-time highs, it often suggests that smart money is quietly repositioning for less favorable conditions ahead.
This doesn't necessarily mean we're on the verge of a major market crash, but it does suggest that the easy money phase of this cycle may be drawing to a close. The fact that SOL can't generate meaningful upside momentum despite its strong technological fundamentals and growing ecosystem adoption tells me that macro factors are starting to override individual asset strengths.
For traditional stock market investors, SOL's price action serves as an early warning system. If crypto markets, which typically lead traditional markets both up and down, are showing signs of fatigue, it's worth questioning whether equity markets can continue their relentless march higher indefinitely.
Conclusion: Reading Between the Lines
Solana's current chart setup is about much more than one blockchain's price movements. It's a window into changing market psychology and a potential harbinger of broader risk asset challenges ahead.
The technical levels are clear: $144 support below, $187 resistance above, with $222 representing the level that would need to break for any meaningful bullish revival. But the real story is what this price action tells us about investor confidence and risk appetite across the entire financial ecosystem.
As I watch SOL struggle to gain traction despite its impressive technology and growing adoption, I'm reminded that in short term, markets are voting machines driven by emotion and positioning. Right now, those votes are being cast with increasing caution—a message that extends far beyond the cryptocurrency space.
Whether you're trading SOL specifically or simply using its price action as a barometer for broader market health, the message is clear: this isn't the time for complacency. Markets that can't go up often find ways to go down, and SOL's chart suggests we may be closer to that inflection point than many realize.
Written by Gareth Soloway, Chief Market Strategist at VerifiedInvesting.com
This article is intended for informational and educational purposes only and does not constitute financial advice. All trading involves risk. Past performance is not indicative of future results.
Trading involves substantial risk. All content is for educational purposes only and should not be considered financial advice or recommendations to buy or sell any asset. Read full terms of service.