Technical Analysis: Ethereum Trading Levels And Insights

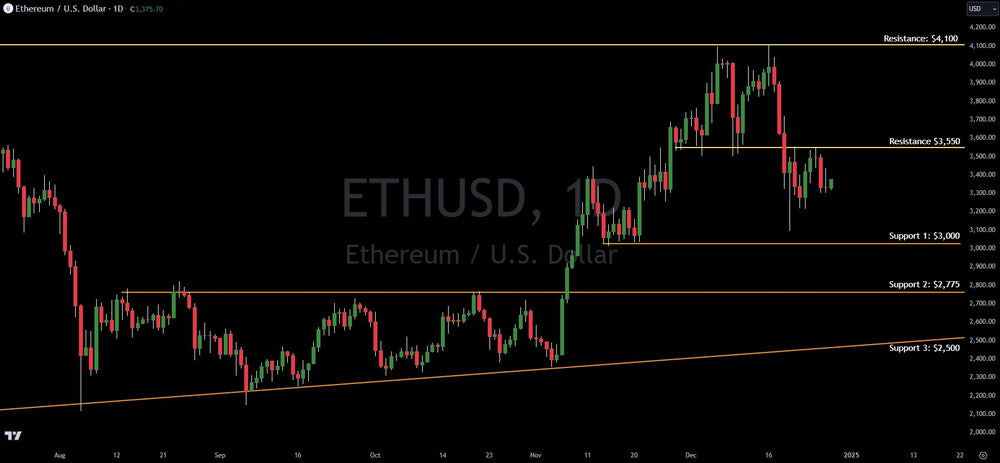
Ethereum's price action is flashing warning signs after a sharp drop from the $4,100 resistance level. The cryptocurrency sliced through the $3,550 support level and is now consolidating in a narrow range, a pattern that often precedes further declines. This "bear flag" formation suggests a potential continuation of the downward trend.
Technical analysis paints a bearish picture for Ethereum in the near term. Key support levels to watch on the downside include $3,000, $2,775, and $2,500. Meanwhile, the broken support at $3,550 now acts as a significant resistance level. Reclaiming this level would be crucial for any bullish resurgence, with the next major hurdle lying at $4,100.
Interestingly, Ethereum's fate may be closely tied to the broader stock market, particularly the Nasdaq. While some crypto enthusiasts are optimistic about the incoming Trump administration, much of that sentiment seems to be already priced in. History suggests that when the Nasdaq falters, cryptocurrencies tend to suffer as well. This implies that investor risk appetite, rather than specific policies, could be the primary driver of Ethereum's price action in the short term.
In essence:
- Ethereum is forming a bearish "bear flag" pattern after breaking key support.
- Further declines could target $3,000, $2,775, and $2,500.
- The Nasdaq's performance may heavily influence Ethereum's price.
Trading involves substantial risk. All content is for educational purposes only and should not be considered financial advice or recommendations to buy or sell any asset. Read full terms of service.


