Technical Analysis On Solana (SOL): Bear Flag Formation
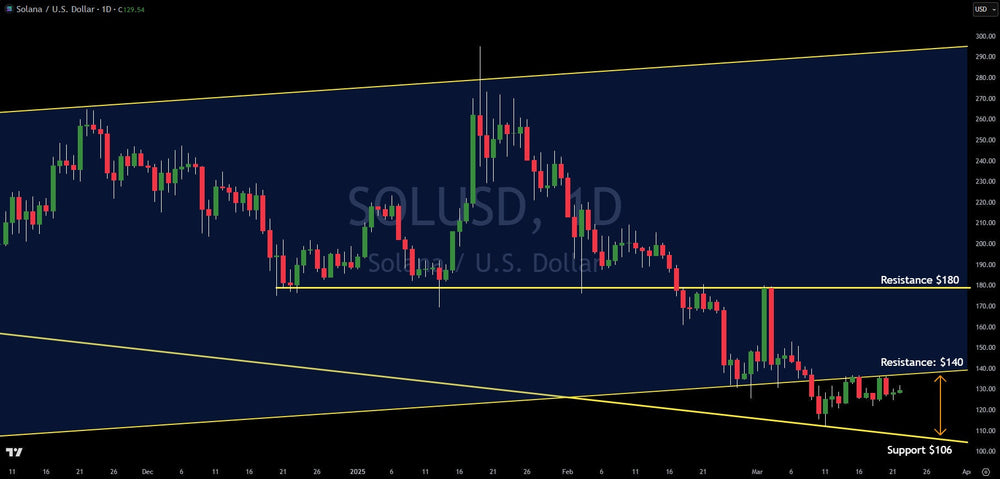
Solana (SOL) is currently navigating a period of weakness, trading within a defined range between resistance at $140 and support at $106. This consolidation is occurring within a bearish technical pattern known as a bear flag, which generally suggests a higher probability of downward continuation. The formation of this bear flag signals to traders that a move lower towards the $106 support, and potentially further, is more likely than a breakout above the $140 resistance level.
A critical level to watch is the $106 support. Should Solana break below this point, the next significant area of technical support doesn't appear until the $78 mark. This highlights the potential for a substantial price decline if the current support fails to hold.
Conversely, if Solana can muster enough bullish momentum to break above the $140 resistance, the next major technical hurdle lies at $180. A successful break of this resistance could indicate a shift in momentum and potentially pave the way for further upside.
The recent struggles of Solana are not isolated and reflect broader sentiment within the cryptocurrency market. The initial enthusiasm surrounding a potentially more crypto-friendly administration following Trump's inauguration seems to have waned. Investors are now seeking new catalysts to drive market direction, and the lack of immediate positive news is contributing to the cautious outlook.
Adding to the pressure on cryptocurrencies, the stock market has entered a phase of de-risking. This often leads to investors reducing their exposure to higher-risk assets, and cryptocurrencies like Solana are typically categorized as such. This correlation between traditional markets and crypto is further contributing to the bearish sentiment surrounding Solana.
This article is intended for informational and educational purposes only and does not constitute financial advice. All trading involves risk. Past performance is not indicative of future results.
Trading involves substantial risk. All content is for educational purposes only and should not be considered financial advice or recommendations to buy or sell any asset. Read full terms of service.