Technical Analysis On The Ethereum Chart For Investors
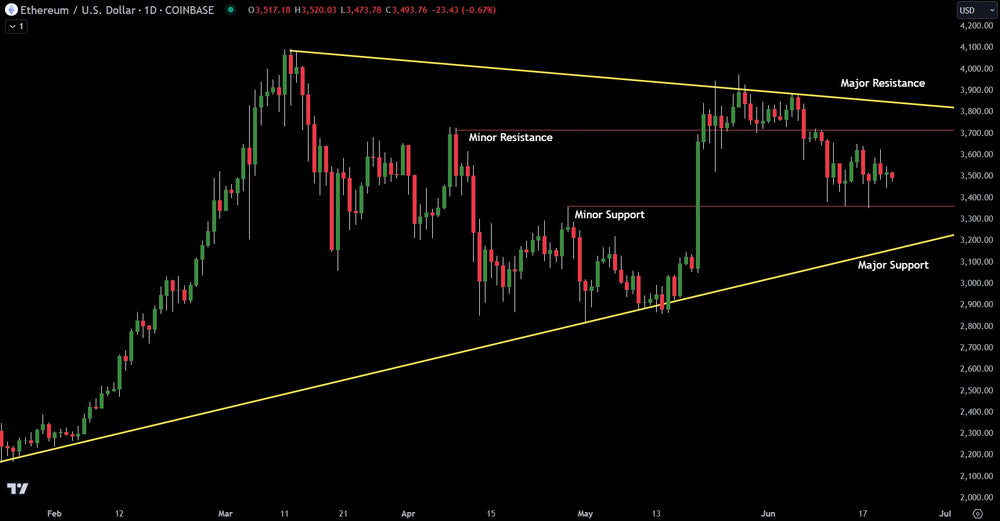
Ethereum chopped sideways over the last week. This pattern formation is called a bear flag as price consolidates following the prior drop.
While the price of Ethereum remains between minor support and minor resistance, the pattern is bearish. This earns Ethereum a negative bias for the next few trading days with the likelihood of further downside greater than upside.
Ethereum continues to stall after the ETF got approval from the SEC. Crypto as a whole has stalled out with alt coins taking a beating.
Verified Investing continues to be the one place investors and traders can find probability based analysis. Trade the charts, ignore the hype and nonsense narratives. Get probabilities on your side.
Trading involves substantial risk. All content is for educational purposes only and should not be considered financial advice or recommendations to buy or sell any asset. Read full terms of service.