Technical Trading: Key Levels On Bitcoin

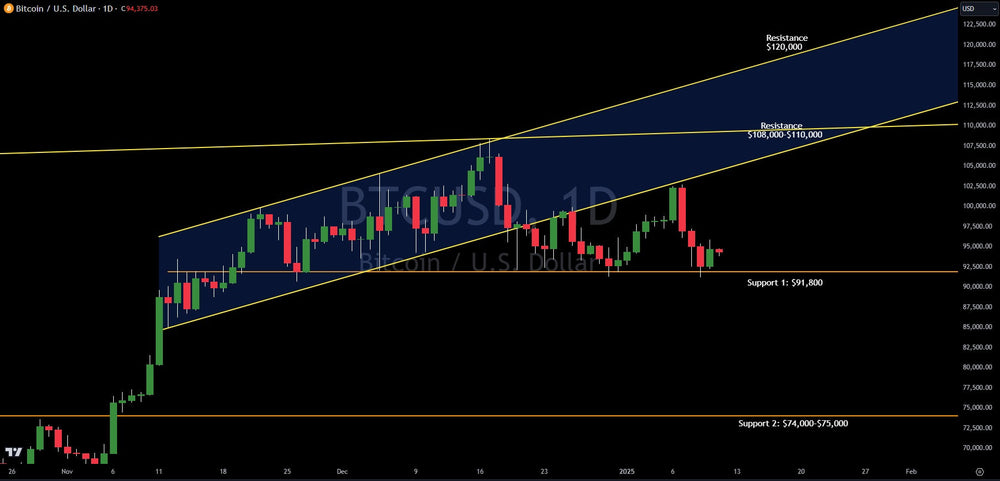
Bitcoin tagged the resistance given in last week's update perfectly. The up-sloping trend line saw price hit, then Bitcoin collapsed back to the support given at $91,200. Technical trading allows investors and traders to view an asset without emotion, just pure probabilities.
The pattern formation on Bitcoin is slightly bearish. In technical analysis, it is called a bearish megaphone pattern. This is where price fell from $108,000 (all-time high) to $91,800 (support). Since then it has stayed within the two diverging trend lines (consolidating). The more Bitcoin hammers on $91,800 support, the weaker it becomes.
The probability of a breakdown below $91,800 now sits at 65% vs. 35% that it rallies back to and beyond the all-time highs.
Should Bitcoin break $91,800 support, price will likely fall to $75,000-$74,000.
Should Bitcoin rally back higher, resistance is now at $108,000-$110,000. Should $110,000 break, upside is $120,000.
The biggest factor for Bitcoin remains the stock market. Over the last week, the NASDAQ and S&P 500 fell sharply. Bitcoin responded by falling sharply. This signals that much of the near-term price action on Bitcoin will be determined by investor sentiment. If the stock market falls, Bitcoin is likely to fall.
Learn how to read the charts and data and go from an emotional investor and trader to an institution. Institutions use data to make decisions. Retail investors usually use hype, fear and greed. There is a reason why institutions keep making money while the general retail investor struggles. Verified Investing is committed to evening the playing field.
Trading involves substantial risk. All content is for educational purposes only and should not be considered financial advice or recommendations to buy or sell any asset. Read full terms of service.


