Trading Ethereum: Technical Analysis Update

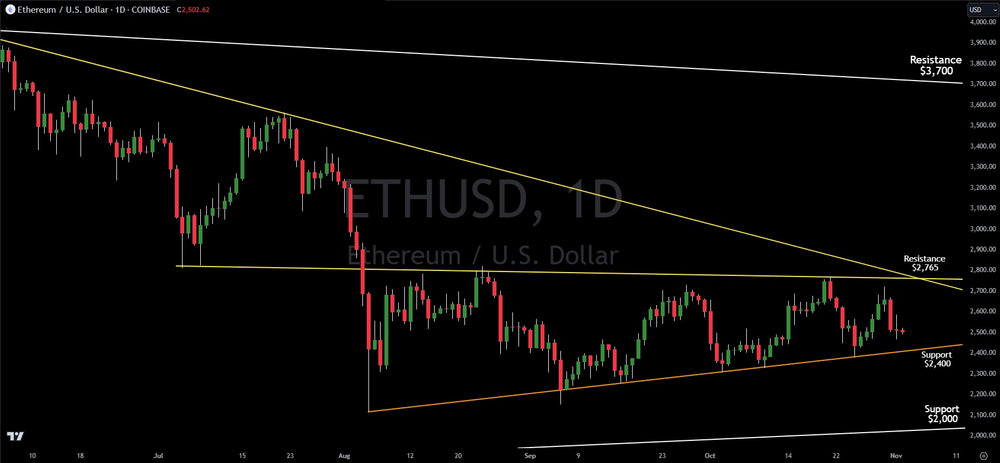
Ethereum continued to chop. This formation since August is known as a bear flag and is an ominous warning to investors. Based on technical analysis, as long as Ethereum stays below the breakout level of $2,765, probability strongly favors a breakdown on the chart.
Ethereum has technical support at $2,400. However, the trend line that is this support has been hit six times. In technical analysis, the more a trend line is attacked by price, the weaker it becomes. Should $2,400 break, there is no major support on Ethereum until $2,000 - $1,900.
While not the probable outcome, if Ethereum breaks and confirms above $2,765, there is no major resistance until $3,700. While unlikely, investors should be ready just in case it does break the resistance at $2,765, as the upside is significant.
In summary, the probability favors a breakdown in price of Ethereum by about 75%-25%.
While other media outlets bombard you with narratives and emotional appeals, Verified Investing delivers clarity. We use charts and data to provide objective probability analysis, giving you the edge in the markets.
Trading involves substantial risk. All content is for educational purposes only and should not be considered financial advice or recommendations to buy or sell any asset. Read full terms of service.


