Trading Levels On Bitcoin: Key Technical Analysis
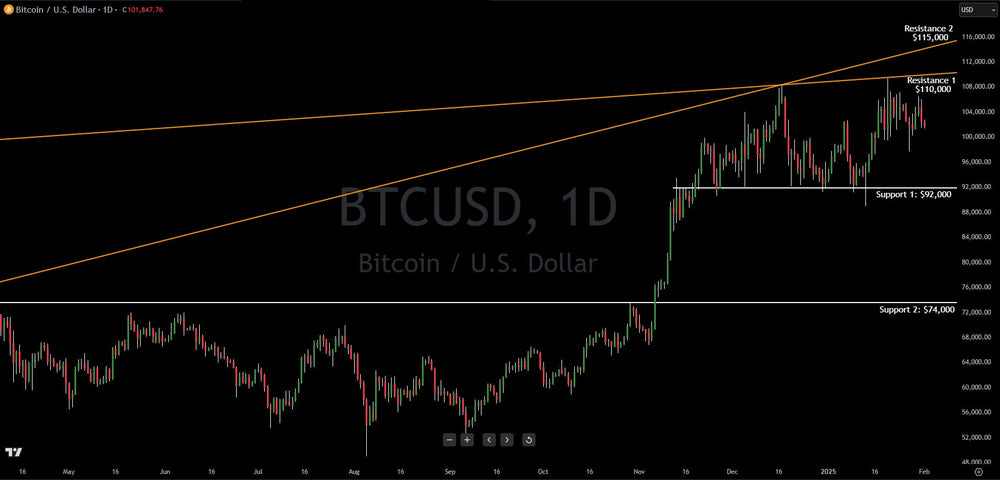
Bitcoin's price remains range-bound, fluctuating between $92,000 support and $110,000 resistance, even as MicroStrategy (MSTR) aggressively accumulates more. Their latest half-billion dollar capital raise for Bitcoin purchases failed to ignite a price surge, suggesting the market has become desensitized to these announcements. This price action largely mirrors the Nasdaq and broader risk asset sentiment.
Since breaking above $92,000 in early November 2024, Bitcoin has been consolidating within this range. A breakout above $110,000 could propel it towards the next resistance levels at $115,000 and then $123,000. However, a significant long-term trendline, connecting the 2017 bull market peak with the 2021 highs, currently intersects around the $110,000 level, posing a formidable challenge. Historically, such long-term trendlines carry considerable weight in technical analysis.
Conversely, a breakdown below $92,000 could lead to a rapid descent towards the $74,000 support level, the previous all-time high from March 2024.
The primary headwind for Bitcoin remains its correlation with risk assets. A stock market correction could trigger a sharp decline in Bitcoin's price, as historical data suggests.
On a positive note, the increasingly favorable regulatory landscape for Bitcoin provides underlying support and is expected to continue.
Traders should closely monitor the key support and resistance levels for a decisive break, which will likely dictate Bitcoin's next significant move.
This article is intended for informational and educational purposes only and does not constitute financial advice. All trading involves risk. Past performance is not indicative of future results.
Trading involves substantial risk. All content is for educational purposes only and should not be considered financial advice or recommendations to buy or sell any asset. Read full terms of service.