Trading Levels On Ethereum Based On Technical Analysis
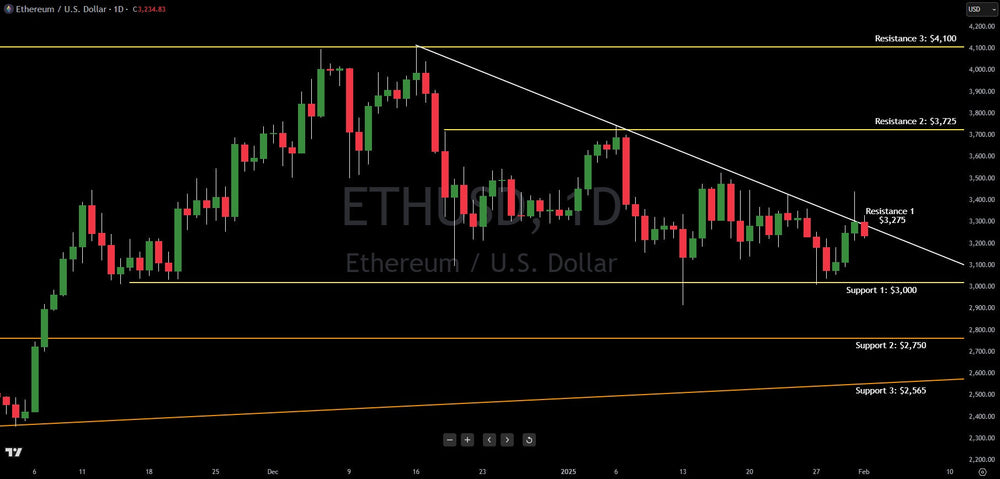
Ethereum attempted a breakout above the $3,275 resistance level on January 31st. Price spiked as high as $3,442. However, by the end of the trading day, Ethereum was hammered back below the key breakout trend line.
This trend line makes up a wedge pattern. The wedge pattern is slowly squeezing price. By mid-February (at latest), Ethereum will be forced to either breakout or breakdown from the wedge.
The bottom of the wedge is a horizontal trend line at $3,000. Should this support level break, there is downside to $2,750, then $2,565.
If Ethereum can break higher above the $3,275 level, there is upside to $3,725, then $4,100.
Overall, Ethereum is still ruled by the stock market. What does this mean? It tends to trade with the stock market. On January 31st, the stock market opened sharply higher. This is when Ethereum pushed above resistance at $3,275. However, the stock market lost all its gains on President Trump's tariff plans for Canada, Mexico and China. As the stock market fell, so did Ethereum.
This continues to bring an additional risk for crypto investors. While the utility of Ethereum is solid, fear in risk assets still can make it sell.
Remember, these are potential trading levels for day and swing traders, nothing more. They are meant for educational purposes only.
This article is intended for informational and educational purposes only and does not constitute financial advice. All trading involves risk. Past performance is not indicative of future results.
Trading involves substantial risk. All content is for educational purposes only and should not be considered financial advice or recommendations to buy or sell any asset. Read full terms of service.