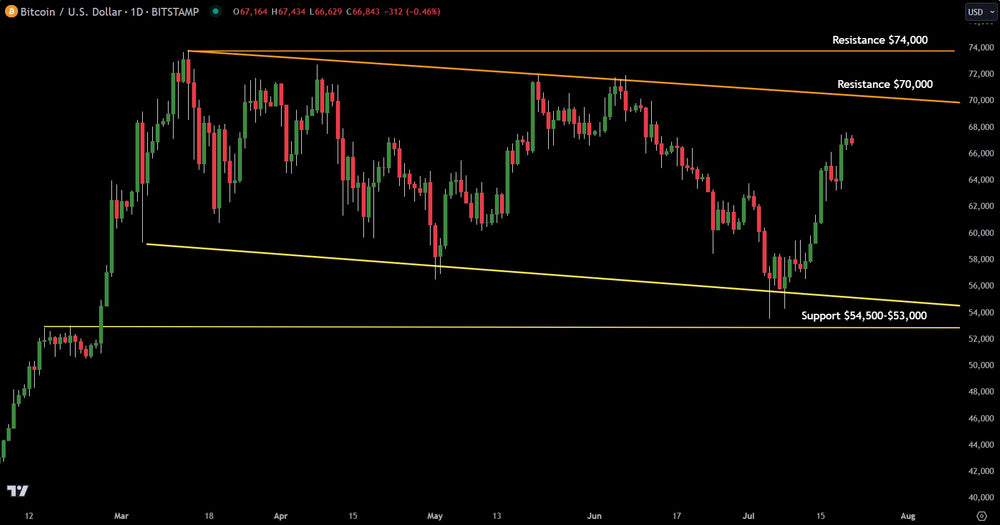
Trading The Bitcoin Chart With Support & Resistance

Bitcoin appears to be back in bull market mode. The largest cryptocurrency by market cap has surged 25% since its July 5th low. Interestingly enough, this low was the same day as Microsoft (MSFT), Meta Platforms (META) and other mega cap tech stocks were at all-time highs. As the trillion-Dollar stocks have pulled back, Bitcoin has rallied.
This shows money flow rotating from tech stocks to Bitcoin and is important for the stability of Bitcoin as a safety asset.
As Bitcoin climbs, key resistance is found on the chart at $70,000 and $74,000. Major technical support is $53,000 to $54,500.
Overall, Bitcoin's relative strength as mega caps pull back is a significant development. Pull backs into support are buying opportunities until proven otherwise.
Trading involves substantial risk. All content is for educational purposes only and should not be considered financial advice or recommendations to buy or sell any asset. Read full terms of service.


