GBP/USD (British Pound/U.S., Dollar) Into Major Chart Resistance
Analysis of GBP/USD Approaching Critical Resistance Zone
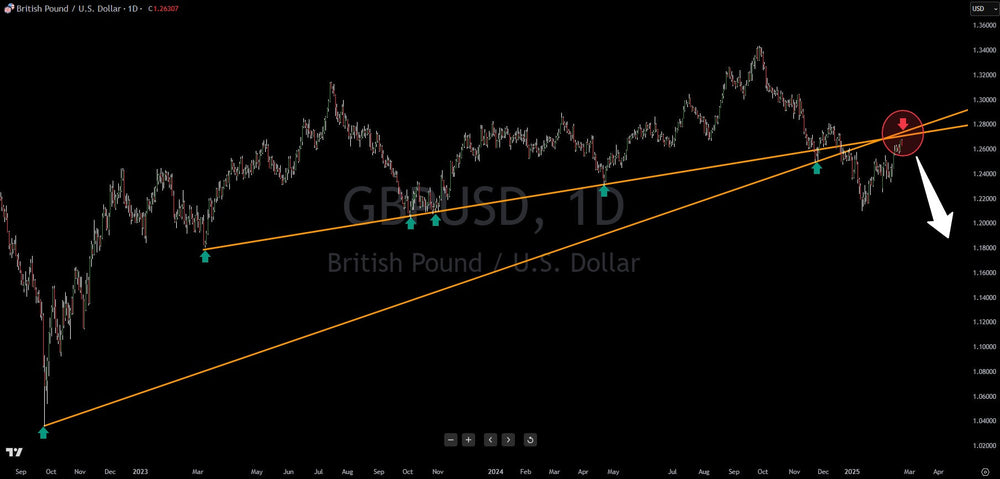
The British Pound/U.S. Dollar (GBP/USD) currency pair is currently navigating a pivotal juncture, approaching a confluence of significant resistance levels that suggest a potential bearish reversal. Technical analysis reveals a critical resistance zone between $1.27 and $1.275, formed by the convergence of two prominent trend lines. These trend lines, previously acting as reliable support levels, were decisively breached during a preceding bearish phase, transforming them into formidable resistance barriers.
The psychological significance of these levels cannot be overstated. When former support is broken, it often morphs into resistance, as traders who were previously long at those levels may look to exit their positions, adding to selling pressure. Moreover, the convergence of two distinct trend lines reinforces the strength of this resistance area, suggesting a higher probability of price rejection.
The current upward momentum of the GBP/USD is bringing the pair into direct contact with this resistance zone. As price tests these levels, traders should be keenly aware of the potential for a significant downturn. The confluence of factors increases the likelihood of a bearish reversal, potentially triggering a substantial sell-off.
Downside Targets and Risk Assessment
Should the GBP/USD fail to breach the $1.27-$1.275 resistance zone and instead initiate a decline, the next major downside support level is projected to be around $1.04. This represents a potential drop of over 20%, highlighting the magnitude of the potential bearish move. Such a decline would represent a significant shift in market sentiment and could be driven by a confluence of fundamental and technical factors.
This article is intended for informational and educational purposes only and does not constitute financial advice. All trading involves risk. Past performance is not indicative of future results. Trading involves substantial risk. All content is for educational purposes only and should not be considered financial advice or recommendations to buy or sell any asset. Read full terms of service.
Trading involves substantial risk. All content is for educational purposes only and should not be considered financial advice or recommendations to buy or sell any asset. Read full terms of service.