GBP/USD Technical Analysis: Here Are The Key Levels To Trade
The British Pound/U.S. Dollar (GBP/USD) has experienced a notable rally recently, climbing from the 1.21 level to around 1.30. Technical analysis suggests that further upside momentum is possible in the short term, until the currency pair encounters significant resistance.
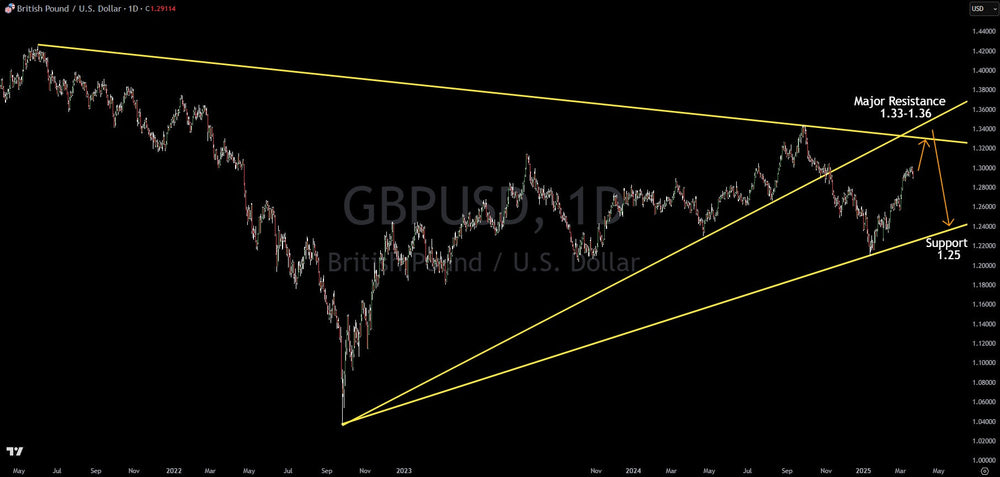
A key resistance zone lies between 1.33 and 1.36. This area is defined by the convergence of two important trend lines. The upper boundary of this zone is formed by a downward-sloping trend line connecting the high points reached in 2021 and 2024. Conversely, the lower boundary is established by an upward-sloping trend line that links the lows from September 2022, April 2024, and August 2024, highlighting the recent bullish momentum.
The confluence of these two trend lines within the 1.33 - 1.36 range suggests that this area will likely act as a strong resistance level for the GBP/USD. Upon reaching this zone, it's plausible to anticipate a significant pullback. A potential target for this pullback is the major support level at 1.25. This support level is identified by drawing a trend line connecting the low from September 2022 through the low established in January 2025.
Looking at the broader picture, the recent price action indicates a potential shift towards a longer-term uptrend for the GBP/USD. The formation of higher lows and higher highs on the chart suggests a developing bullish structure that could persist over the coming years. However, the anticipated resistance zone between 1.33 and 1.36 will be a crucial test of this emerging uptrend. A decisive break above this resistance could signal further bullish continuation, while a rejection could lead to the aforementioned pullback towards the 1.25 support level.
Traders and investors should closely monitor price action within the 1.33 - 1.36 resistance zone for confirmation of either a breakout or a reversal. The interaction with this zone will provide valuable insights into the future trajectory of the GBP/USD.
This article is intended for informational and educational purposes only and does not constitute financial advice. All trading involves risk. Past performance is not indicative of future results. Trading involves substantial risk. All content is for educational purposes only and should not be considered financial advice or recommendations to buy or sell any asset. Read full terms of service.
Trading involves substantial risk. All content is for educational purposes only and should not be considered financial advice or recommendations to buy or sell any asset. Read full terms of service.