
Chart Analysis: NASDAQ On The Verge Of 30% Drop
The Nasdaq Composite is nearing its all-time high of 20,2024, prompting a divergence in sentiment. While many retail investors remain bullish and eagerly buy every dip, institutional investors ("smart money") are exhibiting increasing caution.
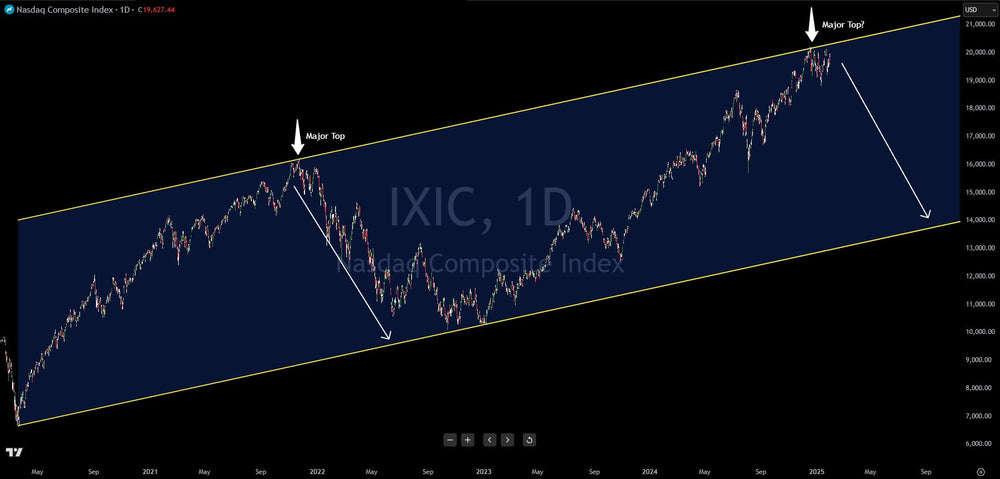
This concern stems from elevated market valuations and a significant technical pattern observed on the Nasdaq chart, tracing back to the Covid lows of 2020. A parallel channel, connecting the 2020 low with the 2022 bear market bottom, and then extended through the 2021 bull market peak and the recent all-time high, reveals a potentially worrisome scenario.
In 2021, the Nasdaq's peak coincided precisely with this upper parallel trendline, followed by a 30% decline to the lower trendline. This historical precedent raises the possibility of a similar correction, potentially targeting the 14,000 level on the Nasdaq.
While past performance is not a guarantee of future results, market history often rhymes. This technical alignment suggests a higher degree of downside risk for the Nasdaq compared to the potential upside.
This article is intended for informational and educational purposes only and does not constitute financial advice. All trading involves risk. Past performance is not indicative of future results. Trading involves substantial risk. All content is for educational purposes only and should not be considered financial advice or recommendations to buy or sell any asset.
Trading involves substantial risk. All content is for educational purposes only and should not be considered financial advice or recommendations to buy or sell any asset. Read full terms of service.


