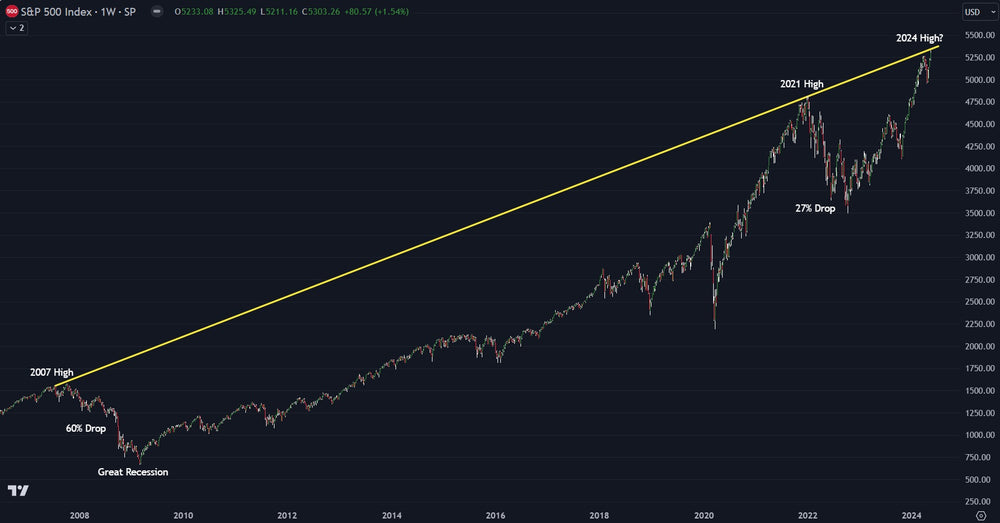
Investor Alert: S&P 500 Approaching Major Technical Chart Level

The S&P 500 has hit new all-time highs. Investors are cheering, meme stocks are running, the VIX (fear index) is below 12 and the soft landing narrative is permeating the airwaves. Could this be the top?
The technical analysis of the S&P 500 says, possibly. A major trend line connects from the highs of 2007 (just before the Great Recession) to the highs of 2021. This trend line extended out reaches 5,340. The S&P 500 is within points of this level. In addition, there is a nasty negative divergence on the RSI both on the daily chart and the weekly chart. This tells technical investors that while price is making new highs, it is retail buying while institutions slowly sell.
Overall, the markets are not pricing in any risks. No geopolitical, no economic or other. This is a concern. It leaves the door open to any number of surprises.
Trading involves substantial risk. All content is for educational purposes only and should not be considered financial advice or recommendations to buy or sell any asset. Read full terms of service.


