
Nasdaq 100 Bear Flag Suggests Another 10% Drop
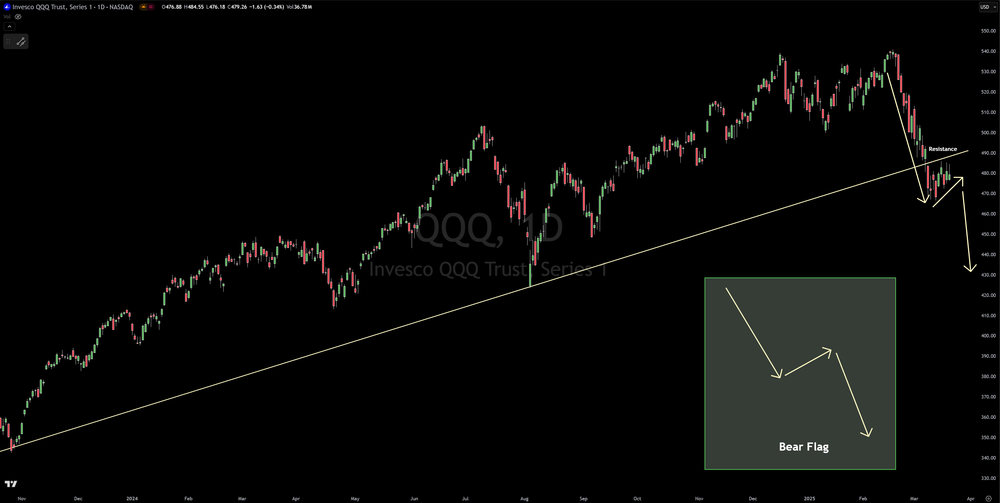
Technical analysis of the Nasdaq 100 indicates a potential for further downside. The index, a key tech sector gauge, has pulled back significantly, currently trading about 11.5% below its recent high. Following a sharp drop of almost 14%, the price action has entered a consolidation phase, exhibiting a sideways to slightly upward trend. This pattern is strongly suggestive of a bear flag, a bearish technical formation that typically emerges after a steep decline and signals a continuation of the downward momentum.
Reinforcing this bearish view is the fact that this bear flag is developing below a crucial resistance trendline. This trendline, which originated from the January 2023 lows and had previously acted as support, has now been broken, potentially indicating a change in market dynamics and the conclusion of the prior bullish trend. The convergence of the bear flag and the broken support trendline strengthens the case for a substantial move lower. Based on typical bear flag behavior, a decline of approximately 10% from the point where the price breaks below the flag could be expected in the near future. This would represent a continuation of the initial sharp decline. Therefore, the technical picture for the Nasdaq 100 suggests a cautious stance for investors, given the possibility of further significant price drops.
This article is intended for informational and educational purposes only and does not constitute financial advice. All trading involves risk. Past performance is not indicative of future results. Trading involves substantial risk. All content is for educational purposes only and should not be considered financial advice or recommendations to buy or sell any asset.
Trading involves substantial risk. All content is for educational purposes only and should not be considered financial advice or recommendations to buy or sell any asset. Read full terms of service.


