
NASDAQ Bearish Pattern Signals 32% Potential Drop To 12,775
The NASDAQ turned sharply lower over the last week, having its worst drop in over 2 years. The NASDAQ fell nearly 6% between Monday and Friday and the VIX (fear index) spiked dramatically.
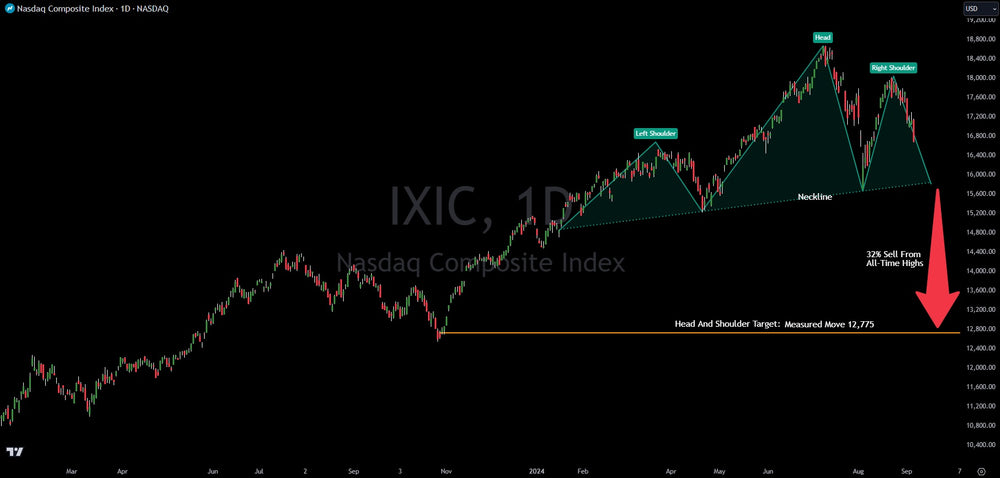
Verified Investing pro traders are cautiously monitoring a potential head and shoulder pattern formation. This is a bearish pattern and should it trigger, downside would be significant. In fact, the target for a downside move on the NASDAQ chart would take it to 12,775. That would be a 32% drop from the all-time highs.
For the pattern to officially trigger, the NASDAQ would have to break the neckline of the head and shoulder formation. This is at an approximate price point of 15,800. That is still over 800 points lower. However, should it break the neckline, the downside price target of 12,775 would become highly probable.
With the economic data being so weak lately, it is a warning sign for a recession. Should a recession hit, the downside target of the head and shoulder pattern on the NASDAQ makes a lot of sense.
Verified Investing is here to analyze charts using technical analysis and data. There is no hype nor narratives. The analysis Verified Investing provides has strict trigger levels and is based on probabilities. Verified Investing fights to even the playing field, helping investors get the same technical analysis and data analysis that institutions use to position their trillion-Dollar portfolios.
This article is intended for informational and educational purposes only and does not constitute financial advice. All trading involves risk. Past performance is not indicative of future results. Trading involves substantial risk. All content is for educational purposes only and should not be considered financial advice or recommendations to buy or sell any asset.
Trading involves substantial risk. All content is for educational purposes only and should not be considered financial advice or recommendations to buy or sell any asset. Read full terms of service.


