
Nasdaq Heading To 13,500? Chart Analysis Says, Yes!
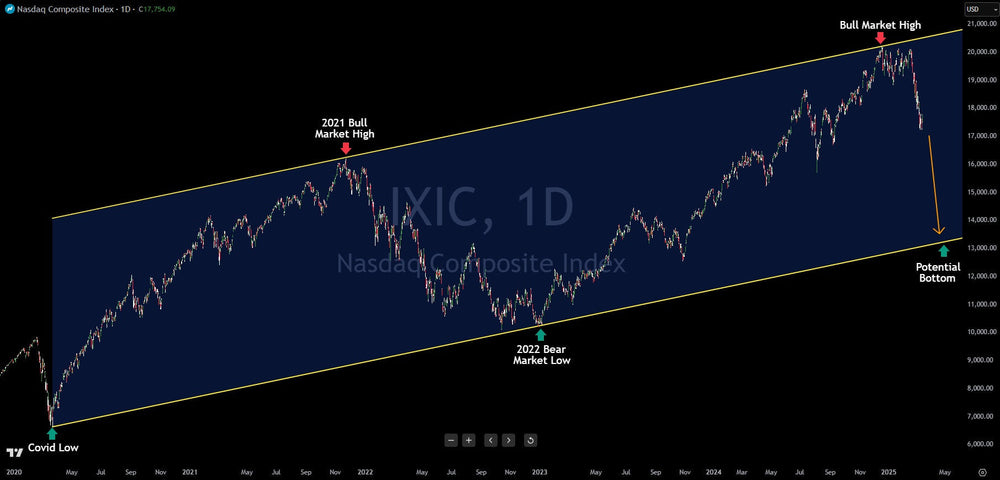
The Nasdaq Composite has experienced a significant correction, currently trading down approximately 13% from its all-time high reached in December 2024. This peak wasn't random; it precisely touched the upper boundary of a well-defined parallel channel that has contained the Nasdaq's price action since the COVID-19 lows of March 2020.
This parallel channel has acted as a reliable indicator, marking both the highs of the bull market phases and the lows of the subsequent corrections in the Nasdaq over the past five years. The recent tag of the upper channel line in December 2024 strongly suggests that this level could represent a major high point for the current bull market phase.
If this analysis holds true, the implication is that the Nasdaq is likely to trend lower in the coming months, potentially towards the lower boundary of this established parallel channel. Interestingly, this lower channel line currently aligns with the 13,500 level (approximately).
Should the Nasdaq indeed decline to test the lower end of this parallel channel, it would represent a substantial correction of around 33% from its December 2024 peak. This potential downside highlights the importance of understanding these technical patterns for investors.
Analyzing charts and identifying patterns like this parallel channel provides investors with a framework for making more informed and logical decisions about market direction, potential highs, and probable lows. By understanding these technical signals, investors can improve their ability to assess risk and potentially put the probabilities in their favor when making investment choices. It's important to remember that while technical analysis can be a valuable tool, it should often be used in conjunction with fundamental analysis and a consideration of overall market conditions.
This article is intended for informational and educational purposes only and does not constitute financial advice. All trading involves risk. Past performance is not indicative of future results. Trading involves substantial risk. All content is for educational purposes only and should not be considered financial advice or recommendations to buy or sell any asset.
Trading involves substantial risk. All content is for educational purposes only and should not be considered financial advice or recommendations to buy or sell any asset. Read full terms of service.


